Microsoft Fabric April 2024 Update


Welcome to the April 2024 update!
This month, you’ll find many great new updates, previews, and improvements. From Shortcuts to Google Cloud Storage and S3 compatible data sources in preview, Optimistic Job Admission for Fabric Spark, and New KQL Queryset Command Bar, that’s just a glimpse into this month’s update.
There’s much more to explore! Read on and let us know what update you’re most excited about and what you found the most helpful.
Fabric Conference Day 1 Keynote is now available!
Did you miss it, or want to hear it again? We are excited to release the FabCon Day 1 Keynote to the Microsoft Fabric YouTube Channel!
If you aren’t already, be sure to subscribe to the Microsoft Fabric Channel! Check out the amazing announcements & demos from Arun, Amir, Wangui, and other awesome presenters. The Day 3 keynotes will be released later this month, and more content will be released regularly moving forward.
Make sure you check out the blog post from Arun, that highlights the announcements from FabCon you can find that here: Announcements from the Microsoft Fabric Community Conference
Earn a free Microsoft Fabric certification exam!
We are thrilled to announce the general availability of Exam DP-600, which leads to the Microsoft Certified: Fabric Analytics Engineer Associate certification.
Microsoft Fabric’s common analytics platform is built on the instantly familiar Power BI experience, making your transition to Fabric Analytics Engineer easier. With Fabric, you can build on your prior knowledge – whether that is Power BI, SQL, or Python – and master how to enrich data for analytics in the era of AI.
To help you learn quickly and get certified, we created the Fabric Career Hub. We have curated the best free on-demand and live training, exam crams, practice tests and more.
And because the best way to learn is live, we will have free live learning sessions led by the best Microsoft Fabric experts from Apr 16 to May 8, in English and Spanish. Register now at the Learn Together page.
Also, become eligible for a free certification exam by completing the Fabric AI Skills Challenge. But hurry, the challenge only runs from March 19 – April 19 and free certs are first-come, first-served! (limit one per participant, terms and conditions apply).
Contents
- Reporting
- Data Connectivity
- Service
- Storytelling in PowerPoint – Improved image mode in the Power BI add-in for PowerPoint
- Storytelling in PowerPoint – Continuous slide show auto refresh
- Storytelling in PowerPoint – Auto populating the slide title
- Introducing the Fabric metadata scanning sample app
- Dynamic Subscriptions for Power BI and paginated reports
- Mobile
- Visualizations
- Analytics
- OneLake
- Admin
- Data Factory
- Dataflows Gen2
- Data pipelines
- Updated Fabric data pipeline homepage
- Pipeline support for CI/CD in public preview
- Data Factory Data Pipelines APIs
- Increase in Pipeline activity limit
- Fabric Warehouse in ADF copy activity
- Edit column type to destination table support added to Fabric Warehouse and other SQL data stores
- SFTP: performance improvements when writing data to SFTP
Reporting
New Visual – 100% Stacked Area Chart
Introducing the new 100% Stacked Area Chart, now available in our core visuals gallery. These visuals display the relative percentage of multiple data series in stacked areas, where the total always equals 100%. It’s perfect for showing the proportion of individual series to the whole and how they change over time. Find it in the visual gallery, on-object dialog, or format pane, right next to the Stacked Area Chart. Give it a try and share your feedback with us!
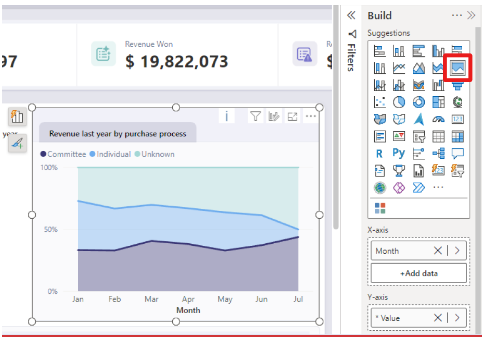
For more detailed information about this new visual, and the new line enhancements you can read our article: PBI Core Visuals
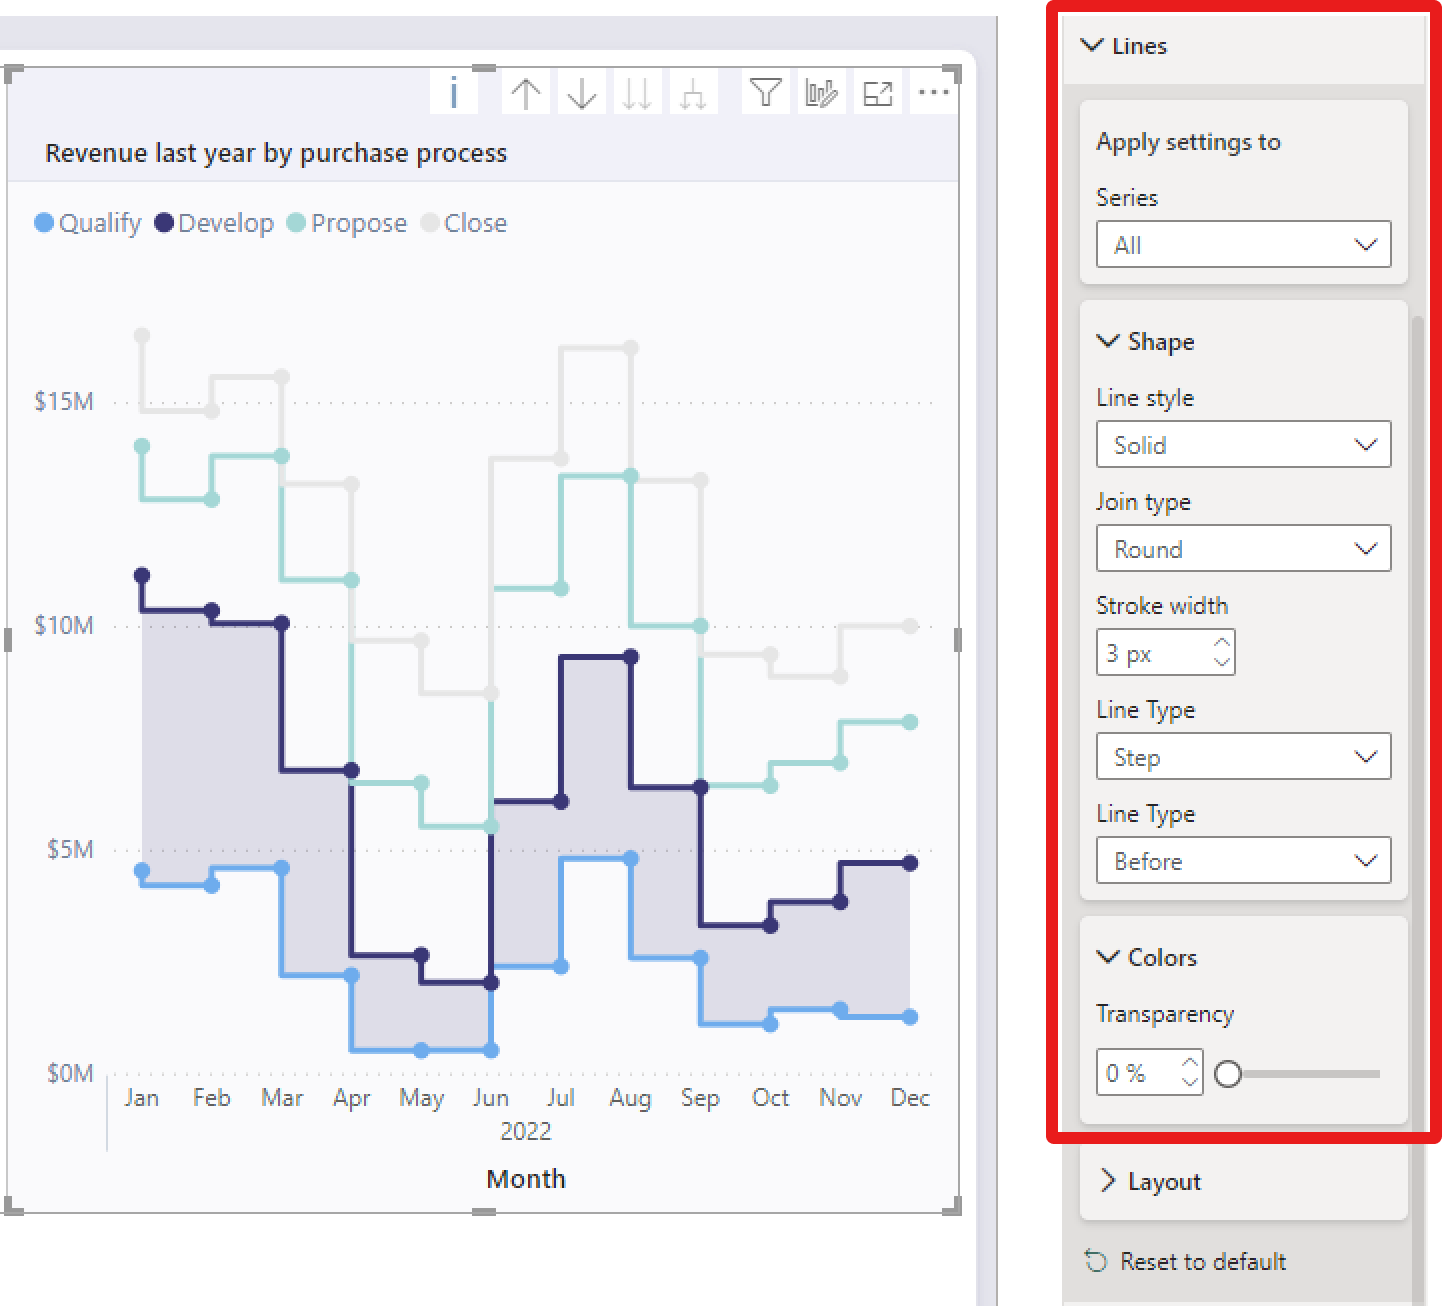
Line enhancements
Take your line charts to the next level with our new line control features.
- Adjust line color transparency under Lines > Colors > Transparency.
- Control the color and transparency of each series by selecting them in the ‘Apply settings to’ dropdown.
- Use Monotone and the new Cardinal smooth type for full control of smooth lines.
- Choose from before, center, and after step lines to align your visual with your story.
Try out these new features and enhance your line charts.
These new line enhancements are just the beginning, there is more to come. Try them out and stay ahead of the curve. We would love to hear about your experience and the amazing things you can achieve with these new features.
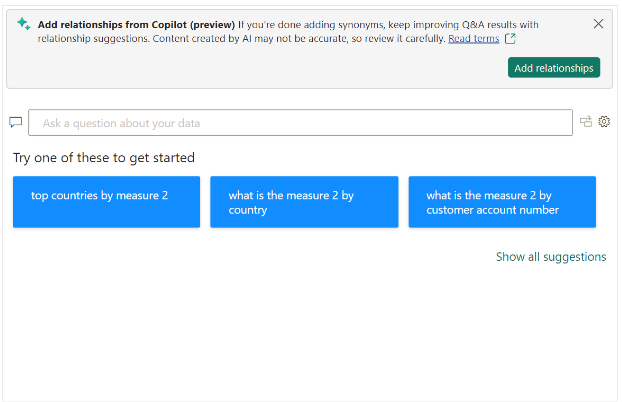
Enhance Q&A with Copilot-generated Linguistic Relationships
Improving your linguistic schema is an important step in making sure that the Q&A visual can understand the wide range of questions people might ask about their data. This is why, back in September, we added a new section into the Q&A setup menu to help you add linguistic relationships to teach Q&A about words which qualify or relate your data.
But we also know that coming up with all the different words people might be using to refer to your data can take time and effort, and we’ve been working on ways to make that process easier for you! In November, we introduced a way for you to quickly generate new synonyms for the names of tables and columns in your model; this month, we’ve introduced the same functionality for linguistic relationships!
When you open a report with a Q&A visual, if you have Copilot enabled and you’ve already added synonyms, you’ll now see a banner prompting you to get relationships with Copilot as well.
Unlike with synonyms, Copilot generated relationships will not be used to understand natural language inputs until you have approved them, so make sure you accept the ones which work for your model!
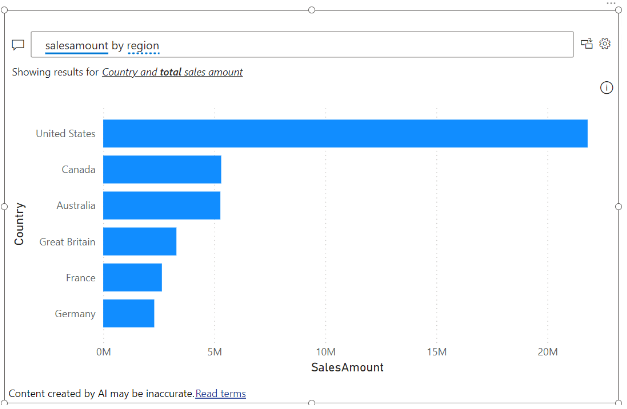
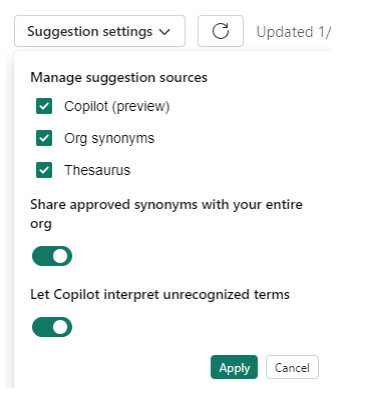
Allow Copilot to help interpret Q&A questions.
You can also now use Copilot to improve the Q&A engine’s term recognition when you ask questions! This new feature will trigger when you ask Q&A a question which uses words or phrases which Q&A doesn’t recognize, but which it detects might be referring to data entities like tables or columns. Then, Copilot will also check those unknown words or phrases to see if there is any reasonable match and if so, return the answer as a visual as though a suggested synonym had been applied.
This feature is not a replacement for synonyms! In fact, adding synonyms for the entities in your semantic model is even more important to create good matches, as they increase the surface area to check for similarities. It will widen the range of inputs Q&A will recognize, but like a multiplier, it will improve recognition for well modeled data much better than it will for poorly modeled data.
This feature will be automatically enabled when you choose to get synonyms with Copilot, but you can also turn it on or off manually in the suggestion settings menu in the Synonyms tab in Q&A setup.
Data Connectivity
Snowflake (Connector Update)
The Snowflake connector has been updated to support the use of Snowflake dynamic tables.
Service
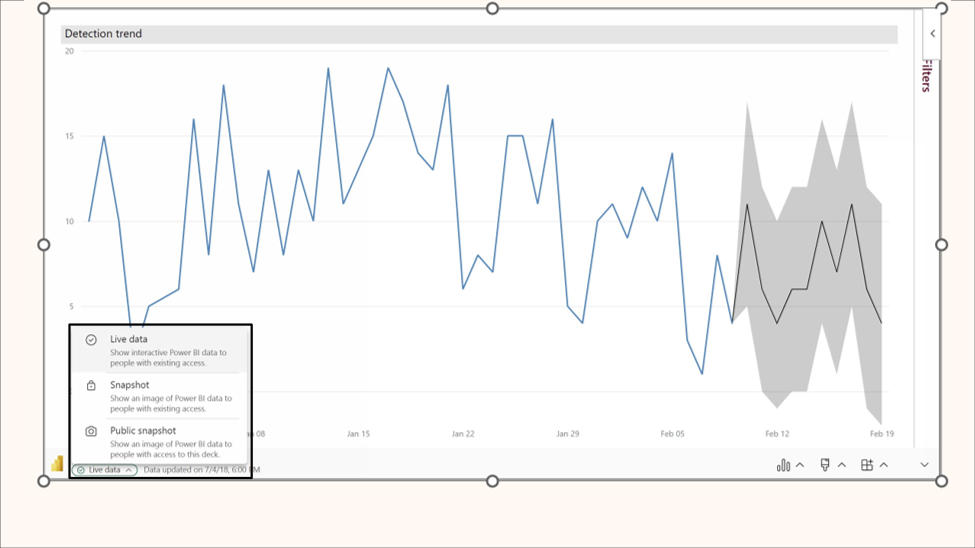
Storytelling in PowerPoint – Improved image mode in the Power BI add-in for PowerPoint
We’ve made saving Power BI content as an image more simple and more powerful.
First, we’ve added a new dropdown menu to the add-in’s footer. In that menu, you can choose whether you want to see live data or a snapshot. So now it is much easier to find where to switch between live data and a static image.
Second, for snapshots, you now have two options:
Public snapshot: Anyone who can view the presentation can view the image.
Snapshot: Only those who have permission to view the report in Power BI will be able to see the snapshot.
Third, we’ve disabled the default snapshot, so that the slide thumbnail doesn’t show the image by default (this also applies when you copy & paste the slide into an email for example), but only after the add-in is loaded and the required permissions have been checked.
And lastly, we honor this setting when you open the presentation in PowerPoint for the web. You still cannot change a live view into a snapshot in PowerPoint for the web, but if you or someone else has changed the view to snapshot in the PowerPoint desktop app, this will be respected, and you will see the snapshot also in PowerPoint for the web.
Storytelling in PowerPoint – Continuous slide show auto refresh
PowerPoint allows you to continuously playback a presentation. This is especially useful when you want to present information in public displays without any human interaction.
If a presentation that is running continuously has slides that include the Power BI add-in, the data in the add-in might become outdated, since the add-in gets the data from Power BI when the slide is loaded, or when the user manually refreshes the data being presented.
With the new automatic refresh in slide show feature, you can set the add-in to automatically pull fresh data from Power BI while the presentation is in slide show mode, ensuring that the presentation will always show the most recent data.
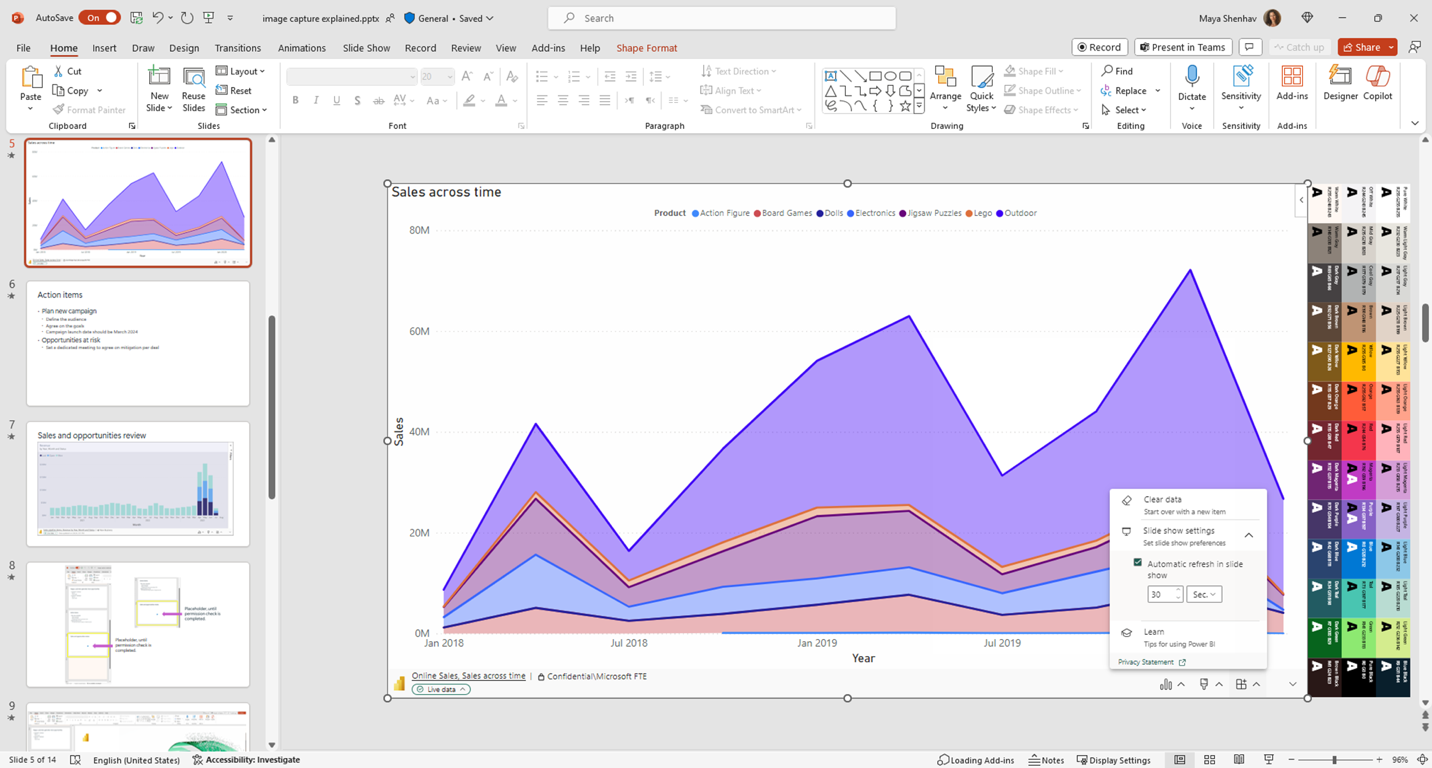
To enable automatic refresh, go to the add-in footer, select Add-in options, choose Slide show settings, check Automatic refresh in slide show and set the desired frequency.
Note that auto refresh only happens in slide show mode and not while you’re editing the presentation.
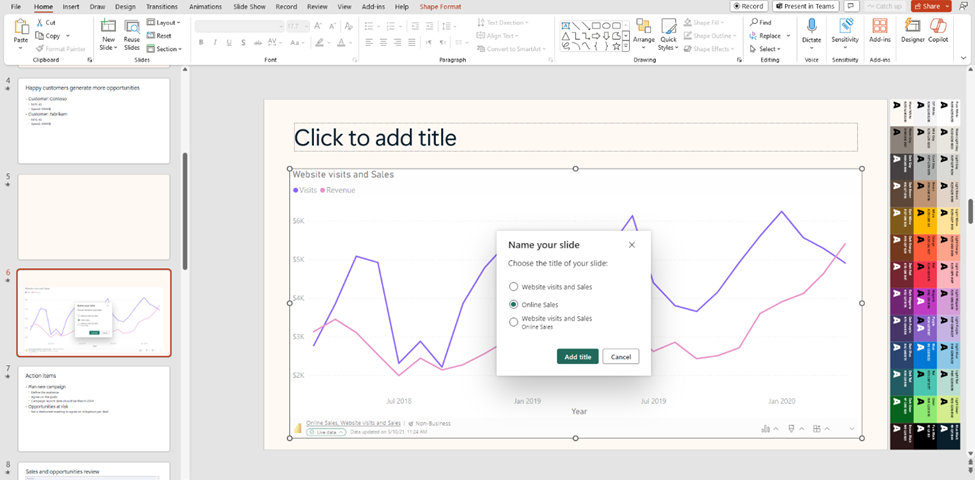
Storytelling in PowerPoint – Auto populating the slide title
When you add the Power BI add-in to an empty slide that doesn’t have a title yet, the Power BI add-in is here to help. It offers you suggestions for the slide title based on the content of you add-in. The title can be the report name, the page/visual name, or both. Just select the desired option and hit Add title.
Introducing the Fabric metadata scanning sample app
We’re delighted to announce the availability of the new Fabric metadata scanning app. This sample application builds upon the metadata scanning capabilities of Fabric’s set of Admin REST APIs collectively known as the scanner APIs. This new app can be used as a reference for admins interested in utilizing the Scanner API to catalog and report on all the metadata of their organization’s Fabric items.
The Fabric metadata scanning sample app handles all the steps for calling the scanner API including authentication, parallelism, throttling, and incremental scanning. In addition, it provides a central configuration file which can be easily modified to suit the specific needs of the caller. Currently authentication is supported both by using a service principal and a delegated token.
The app is available as a Microsoft open-source project, and is open for suggestions and improvements here: Fabric Metadata Scanning
Dynamic Subscriptions for Power BI and paginated reports
We’re pleased to announce that you can now send dynamic per recipient subscriptions to up to 1000 recipients instead of the earlier limit of 50 recipients from the data in the Power BI semantic model. For existing subscriptions, we will automatically send subscriptions up to 1000 recipients if your Power BI semantic model contains that many rows of data. You need to edit the subscription if you don’t want to automatically send subscriptions. Learn more about creating dynamic per recipient subscriptions for Power BI Reports and paginated reports.
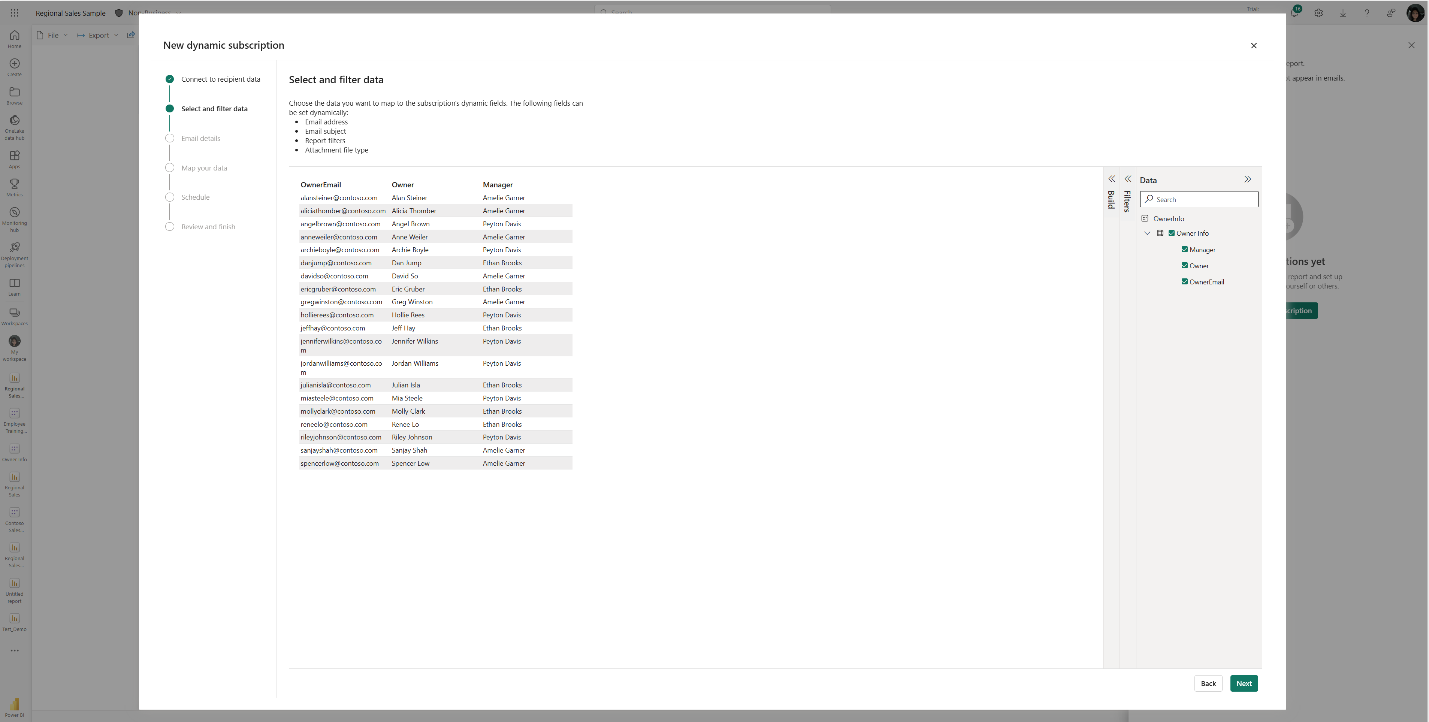
This feature will be available in some regions as soon as today, however depending on the geography in which your Power BI tenant is located, it may take up to two weeks to appear.
Mobile
Supporting Folders in workspace
The Power BI Mobile apps support folders in workspace. So, you can access items that are organized in folders inside of your workspace directly from the mobile app.
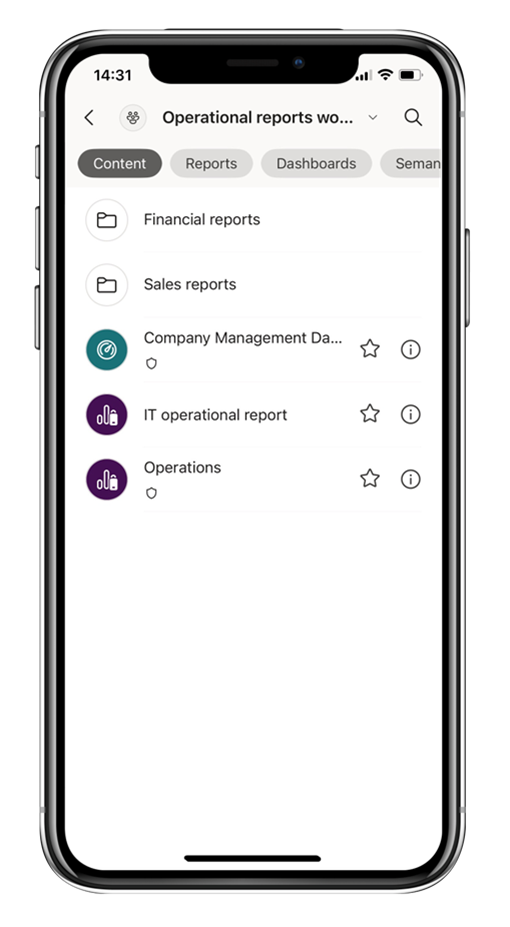
Workspace and folders are Fabric entities, which means that you can add items that are not necessarily Power BI items to a workspace. But the Power BI Mobile apps only support a subset of Power BI items. Therefore, only the Power BI item will be accessible when you are browsing the folder content from the app. If a folder contains only non-Power BI items, it will appear empty in the mobile app.
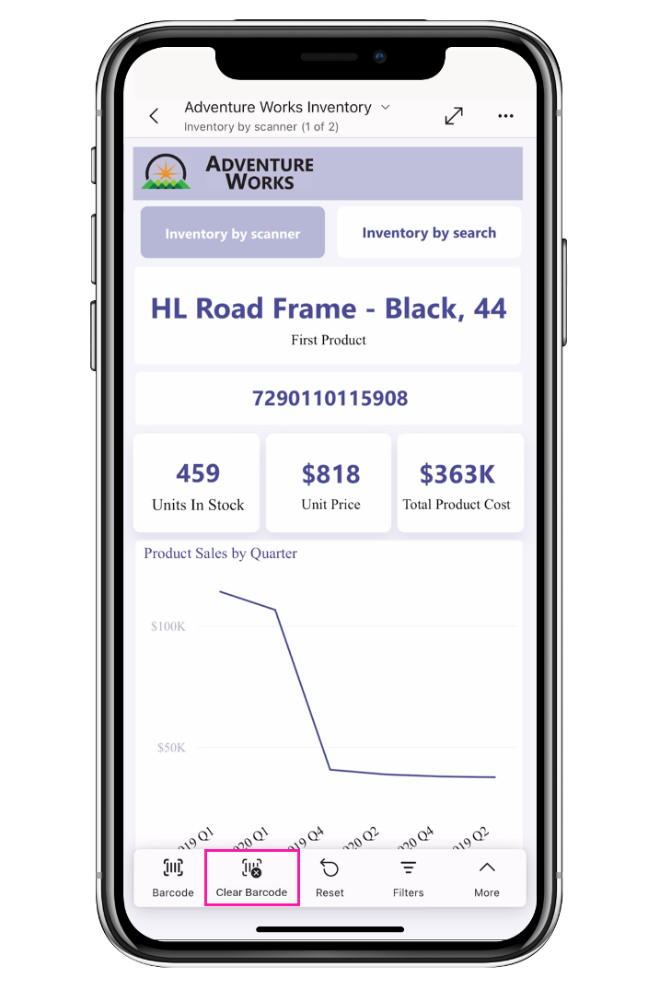
New “Clear barcode” action in the report footer
When a field in your model is marked as a barcode, you can use your mobile device camera to scan the barcodes of real objects to filter reports that are built on this model. This feature is extremely useful for retail, where you can scan the barcode on a piece of merchandise to get a report showing data about the item directly in your mobile app (for example, inventory information, product selling data, etc.).
To make it easier and more intuitive to use barcodes and based on feedback we’ve gotten from our users in stores, we’ve added a new button to the report footer that makes it a one-click action to clear any previously scanned barcode from the report’s filter.
Learn more about scanning barcode from the mobile app
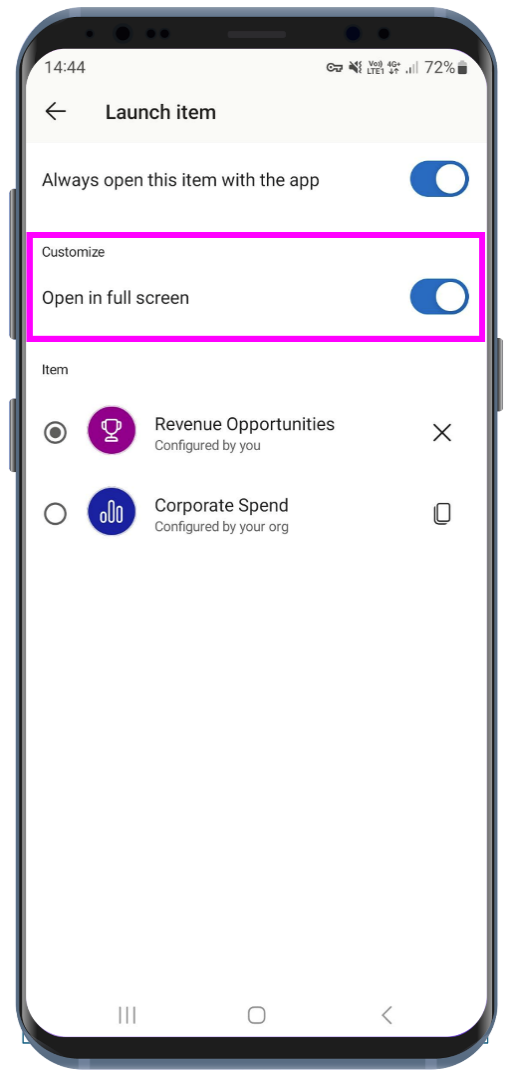
Open Power BI items in full screen mode
We continue to simplify the experience of using the Power BI Mobile apps, always keeping in mind the frontline workers who need quick access to their content. In this monthly update we’ve made it possible to open Power BI items in full screen, so users can view their data at its max.
Opening an item in full screen is supported both for launch items and when using a universal link.
A launch item is a Power BI item (report, page, app, etc.) that the user has selected to automatically open when they open the app. Now, you can also tell the Power BI Mobile app to open this item in full screen mode.
To set a launch item to open in full screen mode, go to:
Settings > Launch item and enable the Open in full screen toggle.
Using an MDM tool that supports an AppConfig file, mobile device administrators can also configure a launch item to be opened in full screen mode for their users.
You can also add the query parameter? fullscreen=1 to a Power BI item’s link. When you use a link with this parameter on your mobile device, the mobile app will open the item in full screen mode.
Visualizations
New Visuals in AppSource
KPI Matrix
Growth Rate Chart by DJEENI v1.4
Aimplan Comment Visual
Financial Reporting Matrix by Profitbase
Making financial statements with a proper layout has just become easier with the latest version of the Financial Reporting Matrix.
Users are now able to specify which rows should be classified as cost-rows, which will make it easier to get the conditional formatting of variances correctly:
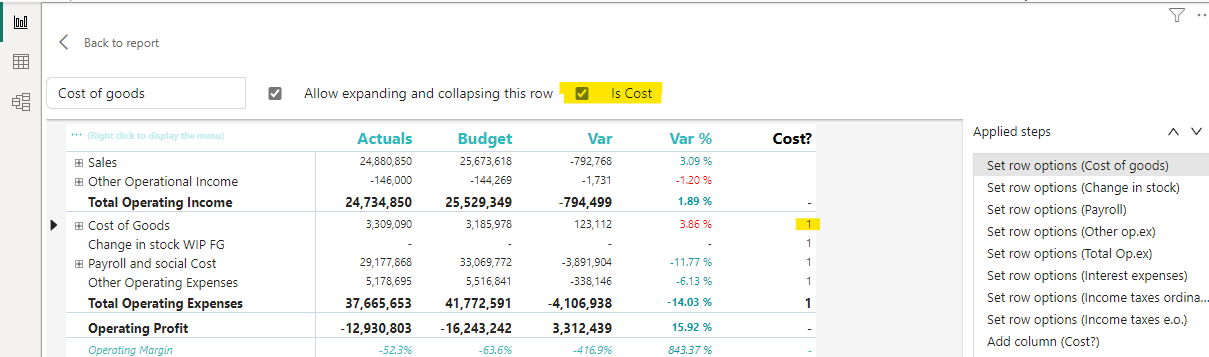
Selecting a row, and ticking “is cost” will tag the row as cost. This can be used in conditional formatting to make sure that positive variances on expenses are a bad for the result, while a positive variance on an income row is good for the result.
The new version also includes more flexibility in measuring placement and column subtotals.
Measures can be placed either:
Default (below column headers)
Above column headers
In rows
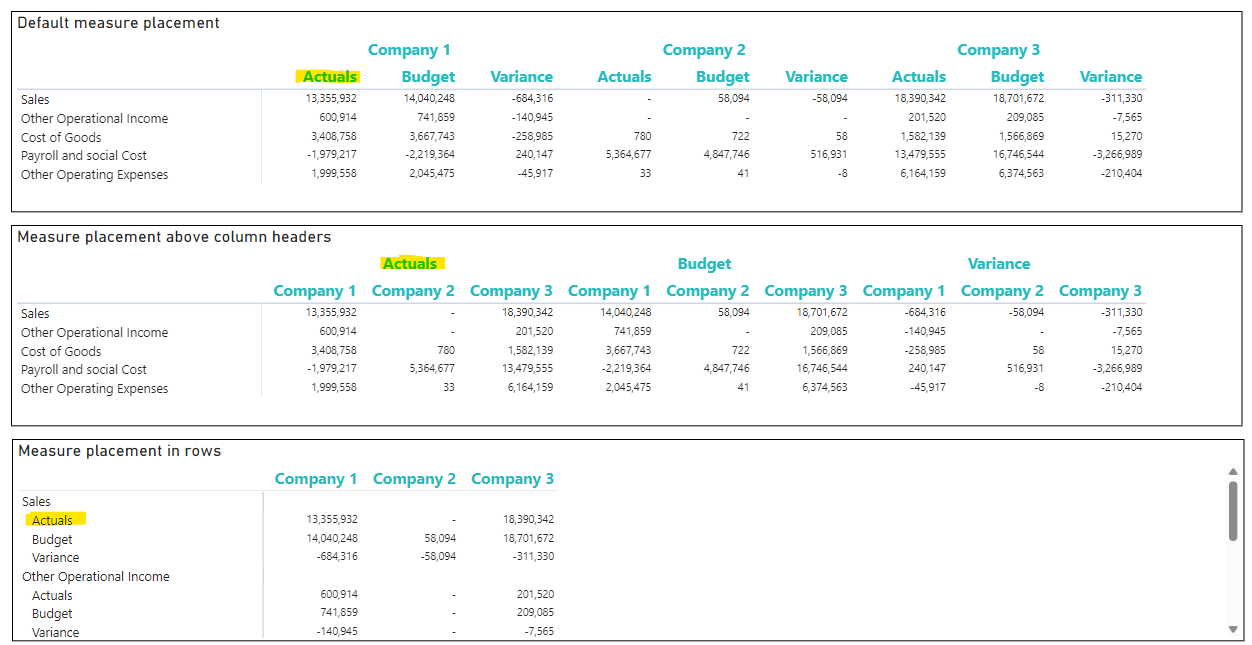
If you have multiple fields showing on your column headers, you can now decide which of these fields you want a column subtotal for.
This is in addition to the already existing features of the Financial Reporting Matrix:
Adding custom rows
Applying company/customer specific themes
Expand/collapse columns
Conditionally hide columns
+ much more
Highlighted new features:
New Format Pane design
*Get the visual from AppSource (fix link) and find more videos here!
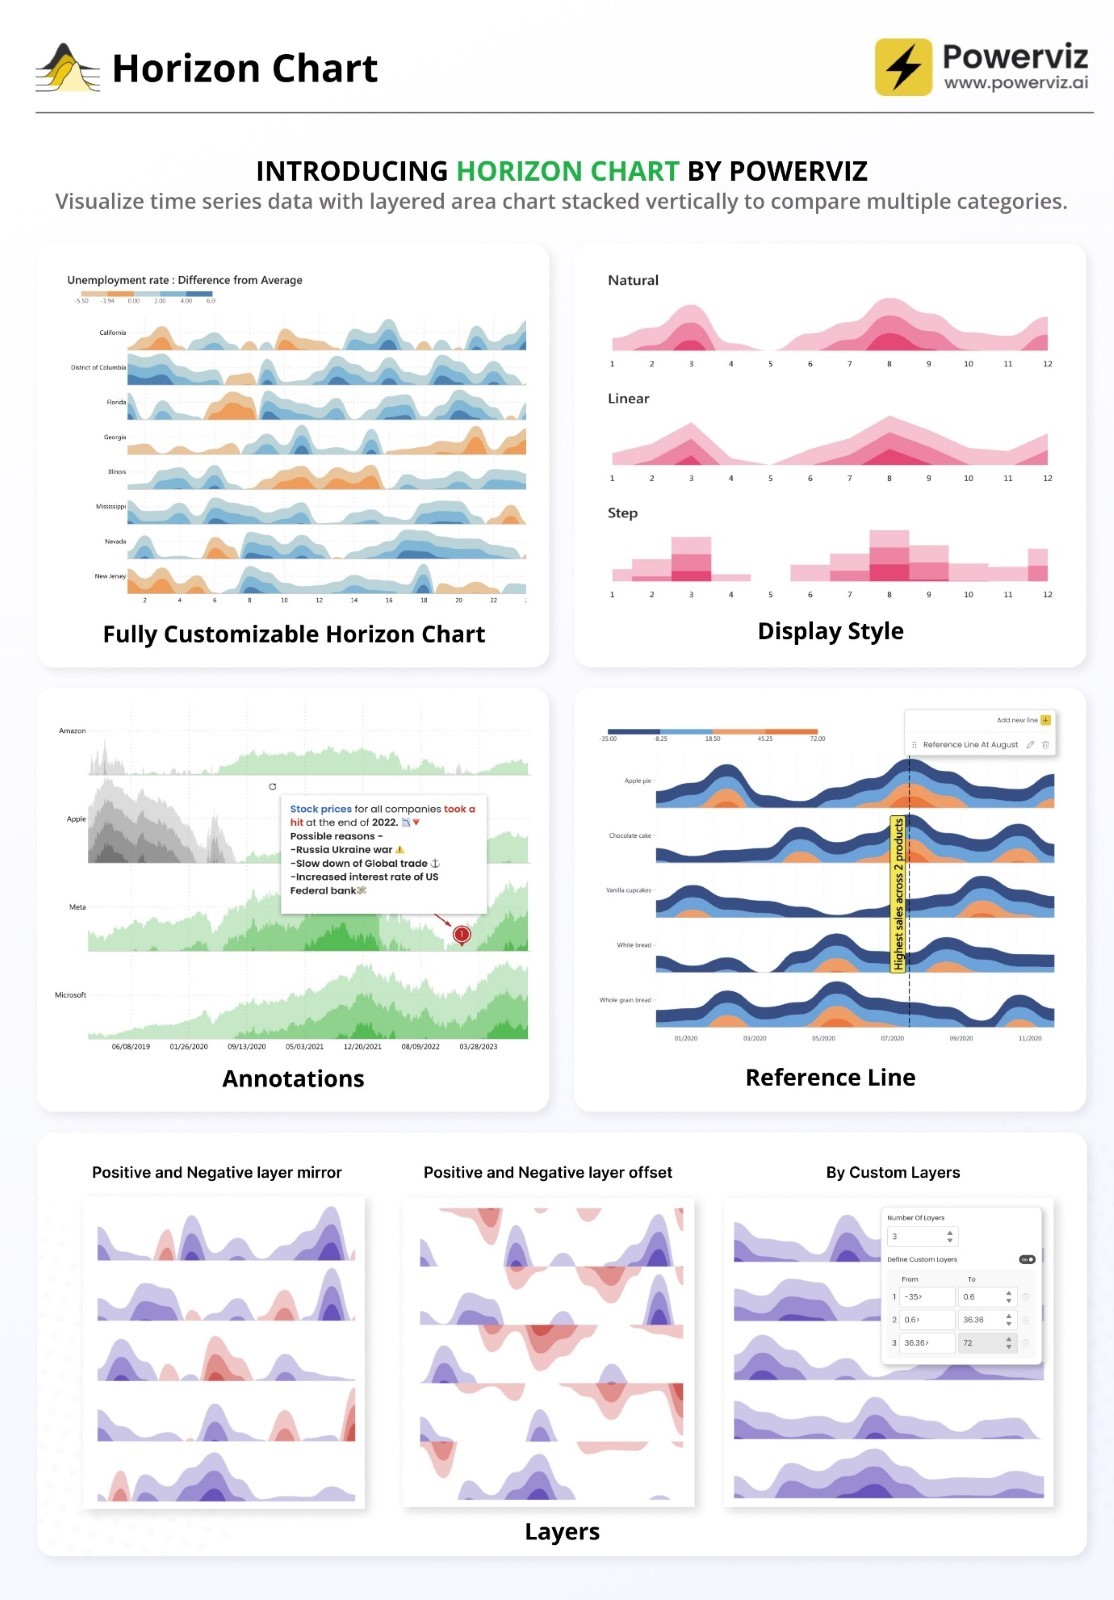
Horizon Chart by Powerviz
A Horizon Chart is an advanced visual, for time-series data, revealing trends and anomalies. It displays stacked data layers, allowing users to compare multiple categories while maintaining data clarity. Horizon Charts are particularly useful to monitor and analyze complex data over time, making this a valuable visual for data analysis and decision-making.
Key Features:
Horizon Styles: Choose Natural, Linear, or Step with adjustable scaling.
Layer: Layer data by range or custom criteria. Display positive and negative values together or separately on top.
Reference Line: Highlight patterns with X-axis lines and labels.
Colors: Apply 30+ color palettes and use FX rules for dynamic coloring.
Ranking: Filter Top/Bottom N values, with “Others”.
Gridline: Add gridlines to the X and Y axis.
Custom Tooltip: Add highest, lowest, mean, and median points without additional DAX.
Themes: Save designs and share seamlessly with JSON files.
Other features included are ranking, annotation, grid view, show condition, and accessibility support.
Business Use Cases: Time-Series Data Comparison, Environmental Monitoring, Anomaly Detection
🔗 Try Horizon Chart for FREE from AppSource
📊 Check out all features of the visual: Demo file
📃 Step-by-step instructions: Documentation
💡 YouTube Video: Video Link
📍 Learn more about visuals: https://powerviz.ai/
✅ Follow Powerviz: https://lnkd.in/gN_9Sa6U

Drill Down Scatter PRO by ZoomCharts
ZoomCharts has just launched the latest addition to their suite of user-friendly custom visuals – Drill Down Scatter PRO. It provides all the features you would expect from a great scatter chart visual, but what sets Scatter PRO apart is the ability to easily drill down. Simply click on a data point and see all the values underneath it.
This way, you can quickly find your answers while also gaining a full understanding of where they come from. Furthermore, the visual’s UI is designed to be smooth and user-friendly for PCs and touch devices, and with cross-chart filtering you can use Scatter PRO to build incredible reports for immersive data exploration.
Main features:
Drill Down: Create a multi-level hierarchy and drill down with just a click.
Dynamic formatting: Apply custom marker colors, shapes, or images to each data point directly from data.
Trendlines: Show a linear or polynomial regression line on the chart.
Thresholds: Display up to 4 line or area thresholds on each axis.
Area Shading: Highlight up to 8 custom areas with rectangles or ellipses.
🌐 Learn more about Drill Down Scatter PRO
Documentation | ZoomCharts Website | Follow ZoomCharts on LinkedIn
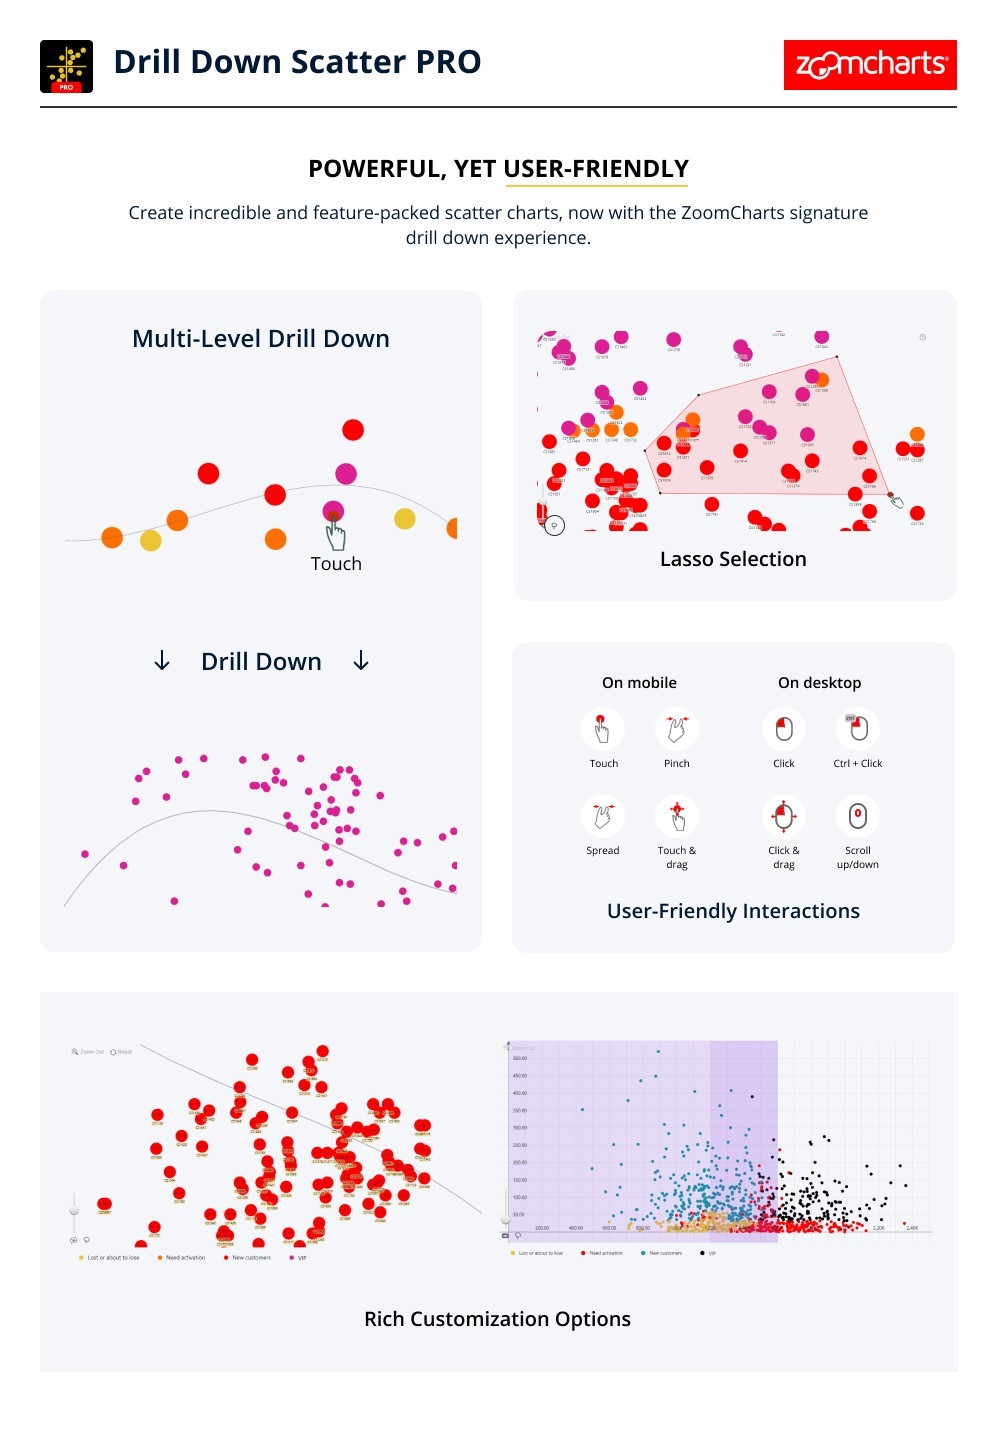

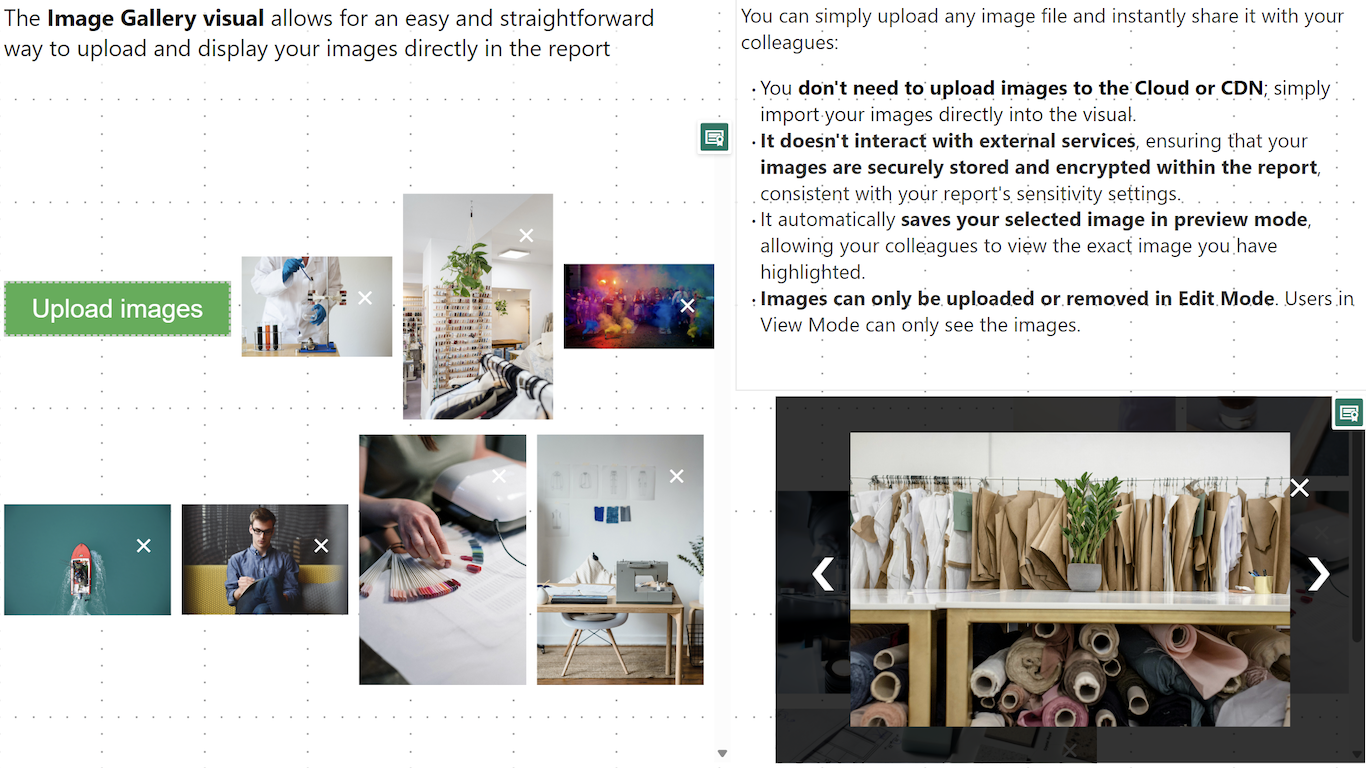
Image Gallery
The Image Gallery is the first visual to be certified by Microsoft that allows for the display of high-quality images and their exportation along with other report content. There is no need to upload images to the Cloud, a CDN, or use any datasets. Simply import your images directly into the visual and share them instantly with your colleagues.
This visual boasts several impressive capabilities:
Microsoft certification ensures that the visual doesn’t interact with external services, ensuring that your images are securely stored and encrypted within the report, consistent with your report’s sensitivity settings.
Automatically saves your selected image in preview mode, allowing your colleagues to view the exact image you have highlighted.
Images can be uploaded or removed exclusively in Edit Mode. Users in View Mode can only view the images.
The visual is compatible with Power BI’s export functionality to PDF and PowerPoint.
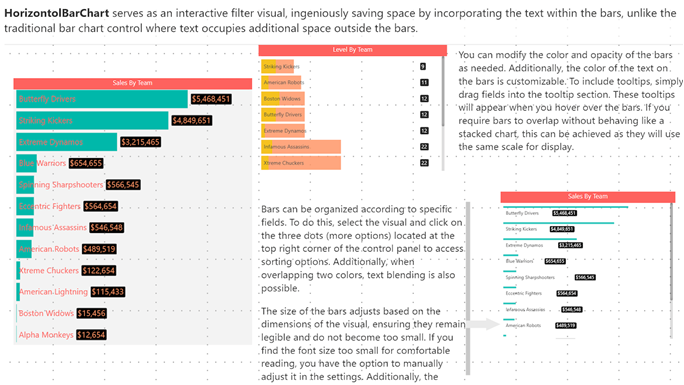
Horizontal Bar Chart
A space-saving horizontal bar chart designed with category labels placed inside the bars for clarity.
This horizontal bar chart serves as an efficient filter to navigate through your data more effectively, optimizing space by placing the category labels within the bars themselves.
This visual boasts several impressive capabilities:
Microsoft certification ensures that the visual doesn’t interact with external services, ensuring that your images are securely stored and encrypted within the report, consistent with your report’s sensitivity settings.
Adjustable Bar Thickness and Spacing: Offers the flexibility to adjust the thickness of the bars and the spacing between them. This allows for optimal use of space and improves readability, especially when dealing with large datasets.
Tooltip Details on Hover: Displays detailed information about each category when the user hovers over a bar. This feature provides additional context and insights without cluttering the visual.
Data-Driven Category Labels: Automatically updates category labels based on the data source. This ensures that the chart remains accurate and up to date, reflecting any changes in the underlying data.
Support for Hierarchical Data: Allows users to drill down into hierarchical categories within the chart. This functionality enables a more detailed data analysis without leaving the context of the initial visual.
Export Options: Offers the ability to export the chart as an image or PDF, facilitating easy sharing and reporting outside of Power BI.
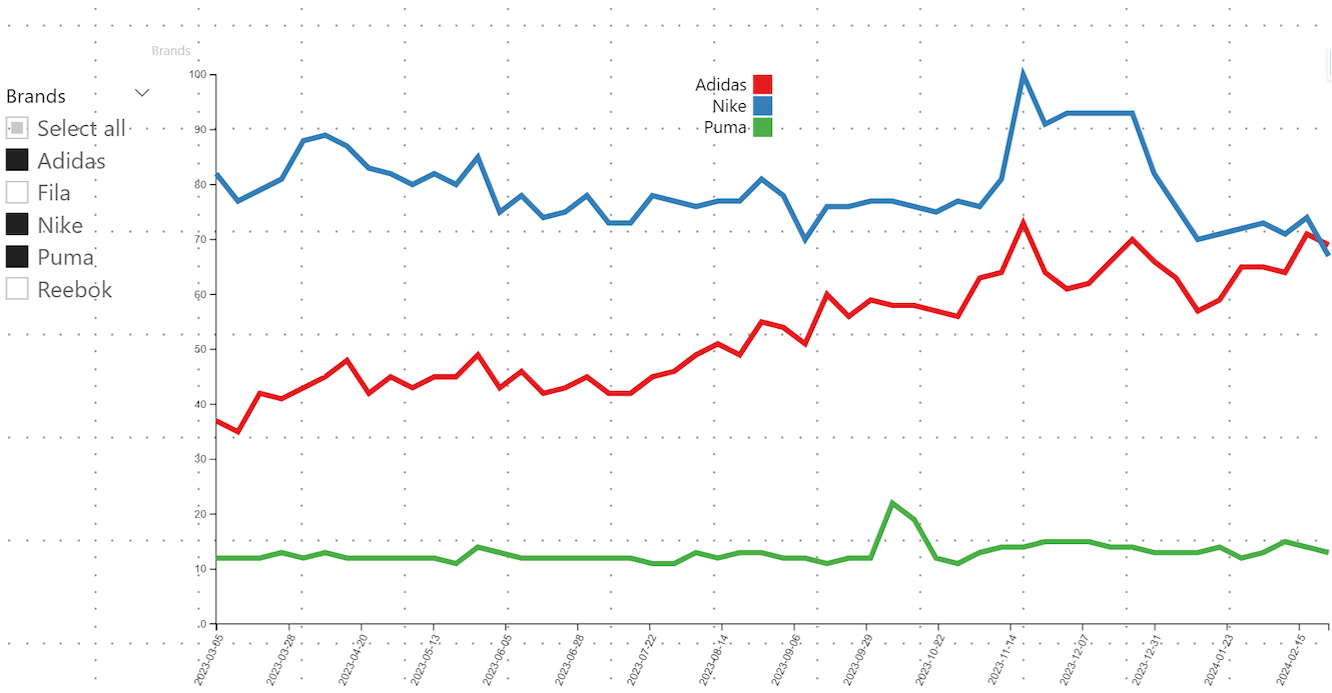
Trends
Introducing the “Trends” visual for Power BI – your gateway to leveraging Google Trends data for strategic business analysis. This innovative visual tool allows you to compare brand popularity, monitor market trends, and gain insights into consumer search behaviors directly within your Power BI environment.
With Trends visual, you can:
Analyze the ebb and flow of brand interest over time to identify market opportunities and competitive threats.
Compare the popularity of products to inform marketing strategies and product development decisions.
Understand seasonal trends to optimize your marketing campaigns and inventory planning.
Securely integrated and easy to use, “Trends” transforms your Power BI reports into a dynamic analysis tool, offering a comprehensive view of the market landscape. Dive into data-driven decision-making with “Trends” and stay one step ahead in the competitive business environment.
Multi-pane Card 1.1
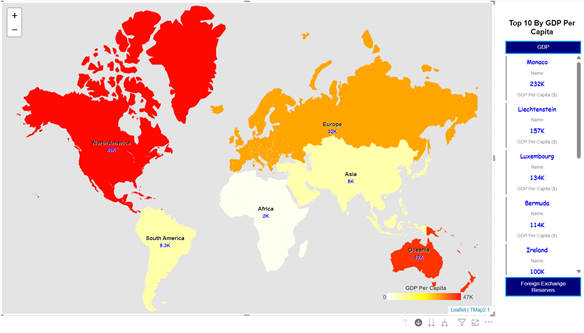
New visual: Multi-pane Card can be used to group and show data in multiple collapsible panes in Power BI reports. It is an alternative to multi-row card visual, but it can combine columns into a few groups and put each group’s data in each pane. It is suitable to show data in detail with a reduced number of report pages.
Screenshot 1 (Show data in 3 groups: Area and Population, GDP and Foreign Exchange Reserves for countries)
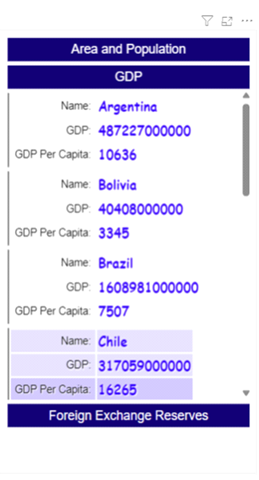
Data can be sorted by a specified column and numbers can be converted to a human readable string. You can also set up how many rows that you want to show on the card. Using these features, it will be very easy to show “Top 10 best performing stores” or “Top 10 worst performing stores” for retail businesses.
Screenshot2 (Combined with drilldown choropleth map to show the top 10 richest countries by GDP per capita for each continent and subregion)
You can go to Microsoft AppSource: Multi-pane Card, to download and try it.
To learn more on how to use it, please read tutorials (https://www.mylocs.ca/tutorials.html#multi-pane-card).
Analytics
Introducing Copilot pane in Power BI Desktop (preview)
Earlier this year, we announced preview of Copilot for all customers with Premium/Fabric capacity in Power BI web. We’re thrilled to share that the same Copilot experience for report creation is now available for preview in Power BI Desktop. With our current preview, users can create reports faster and easier in the Power BI Desktop experience. You can now open the Copilot pane in report view and ask Copilot to:
Create a report page – Copilot will create an entire report page for you by identifying the tables, fields, measures, and charts that would help you get started.
Summarize a semantic model – Copilot will help you understand your Power BI semantic model by summarizing the data in your model.
Suggest a topic – Copilot will suggest topics for your report pages.
Click here to learn more about how to get started.

OneLake
Shortcuts to Google Cloud Storage and S3 compatible data sources (preview)
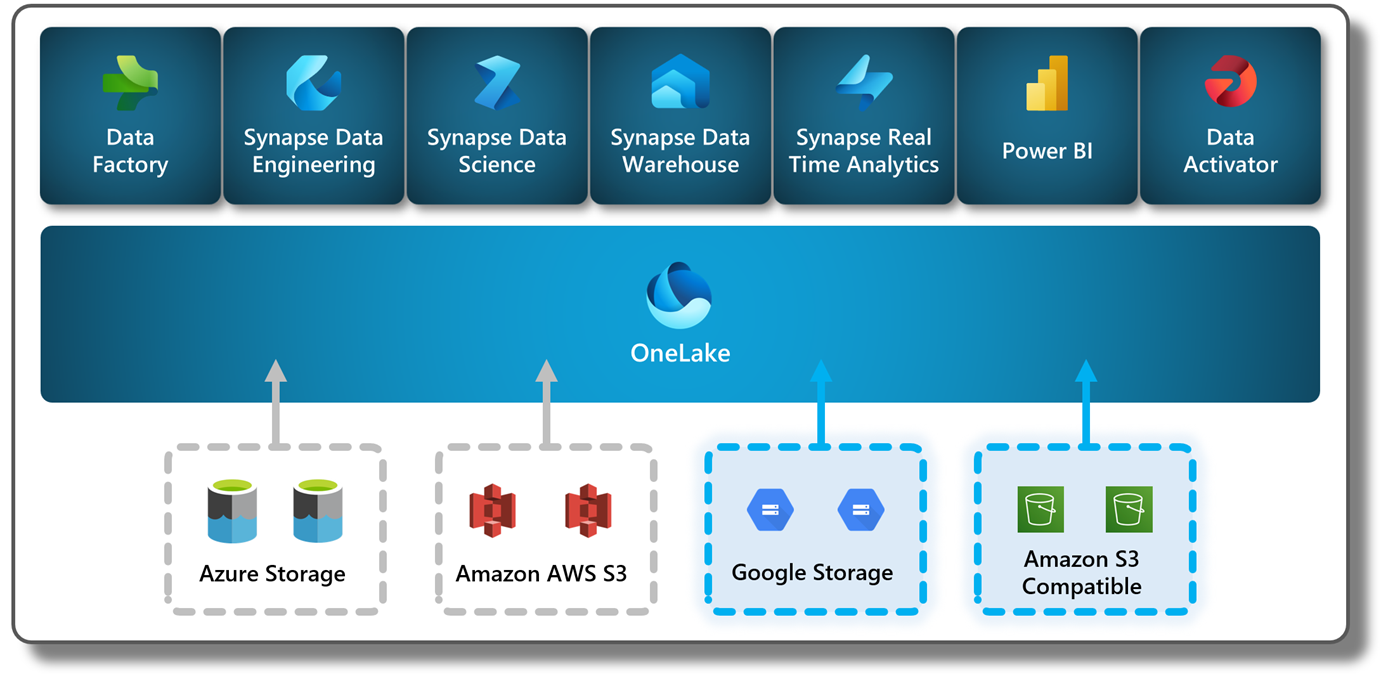
We are excited to announce that you can now create OneLake shortcuts to your Google Cloud Storage (GCS) buckets and S3 compatible data sources!
With the addition of GCS, you can now utilize cross-cloud shortcuts to analyze your data across all three major cloud platforms. Shortcuts in OneLake allow you to connect to your existing data through a single unified name space without having to copy or move data. Just open Lakehouse in Fabric, create a shortcut to GCS, AWS S3 or ADLS Gen2 and immediately start analyzing your data through Spark, SQL and Power BI.
OneLake is also adding connectivity to data sources that offer an Amazon S3 compatible API, a widely supported API offered by many distributed file systems and services that offer object storage. With this new feature, it’s quick and easy to create a shortcut that references your cloud based S3 compatible data sources. The data source endpoint simply needs to offer S3 compatible APIs, be publicly hosted and accessible, and accept the key/secret credentials you provide during shortcut creation. Once you set up your shortcut, you can access and use your data with the many Fabric engines or other services using OneLake’s open APIs.
Learn more in our recent blog posts for S3 compatible shortcuts and GCS shortcuts!
OneLake data access roles (preview)
OneLake data access roles for folders are a new feature that enables you to apply role-based access control (RBAC) to your data stored in OneLake. You can define security roles that grant read access to specific folders within a Fabric item and assign them to users or groups. The access permissions determine what folders users see when accessing the lake view of the data, either through the lakehouse UX, Spark notebooks, or OneLake APIs.
OneLake previously managed data access at the Fabric item level. Access to the OneLake data behind a Fabric item could be granted or removed for users or groups. Data access roles now allow for defining security roles that can grant access to individual OneLake folders within a Fabric item. The granted access inherits to any newly added sub-folders in a transparent manner. Role permissions and user/group assignments can be easily updated through a new folder security UX or through API calls. The security also extends to 3rd party access requests made through the OneLake APIs.
Check out the full announcement blog or jump right into the getting started guide!
Admin
Tenant level Private Link
Organizations today rely on cloud platforms for storage and analysis of data at scale and need to keep up with the accelerating volume of data while protecting sensitive information. While enterprises in Banking, Healthcare, and similar domains require strict data security standards by default, securing business-critical data is the highest priority for all enterprises. We are excited to announce the public preview of an enhanced networking feature, Azure Private Link for Microsoft Fabric, for securing access to your sensitive data in Microsoft Fabric by providing network isolation and applying required controls on your inbound network traffic.
Private Links enable secure connectivity to Fabric by restricting access to your Fabric tenant from an Azure VNet of your choice and blocking all public access. This ensures that only network traffic from that VNet is allowed to access Fabric experiences like Notebooks, Lakehouses, Warehouses in your tenant.
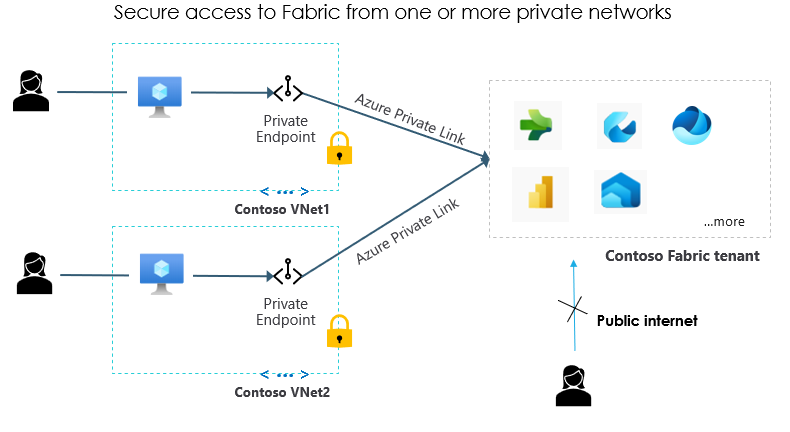
With Azure Private Link, you can:
- Restrict traffic from the internet to Fabric and route it through the Microsoft backbone network.
- Ensure only authorized client machines can access Fabric.
- Comply with regulatory and compliance requirements that mandate private access to your data and analytics services.
While Azure private links were supported in Power BI at a tenant level, we are now extending this feature to other Fabric workloads with this release. For example, connecting to your data in Onelake using the OneLake Explorer can be protected through Private Links. Similarly, you can access Warehouses and Lakehouse SQL endpoints in SQL Managed Studio via Private Links. A list of supported scenarios and limitations can be found at Use private link to access Fabric. for detailed instructions, please refer to How to set up private endpoints to access Fabric.
Managed Private Endpoints for Microsoft Fabric
We are excited to announce the public preview of Managed Private Endpoints for Microsoft Fabric. This feature allows secure connections to data sources that are behind a firewall or not accessible from the public internet. Managed Private Endpoints enable Fabric Data Engineering items to access data sources securely without exposing them to the public network or requiring complex network configurations. These private endpoints provide a secure way to connect and access data from sources like Azure SQL DB or Storage account blocked from public access from your Fabric Spark Notebooks or Spark Job Definitions.
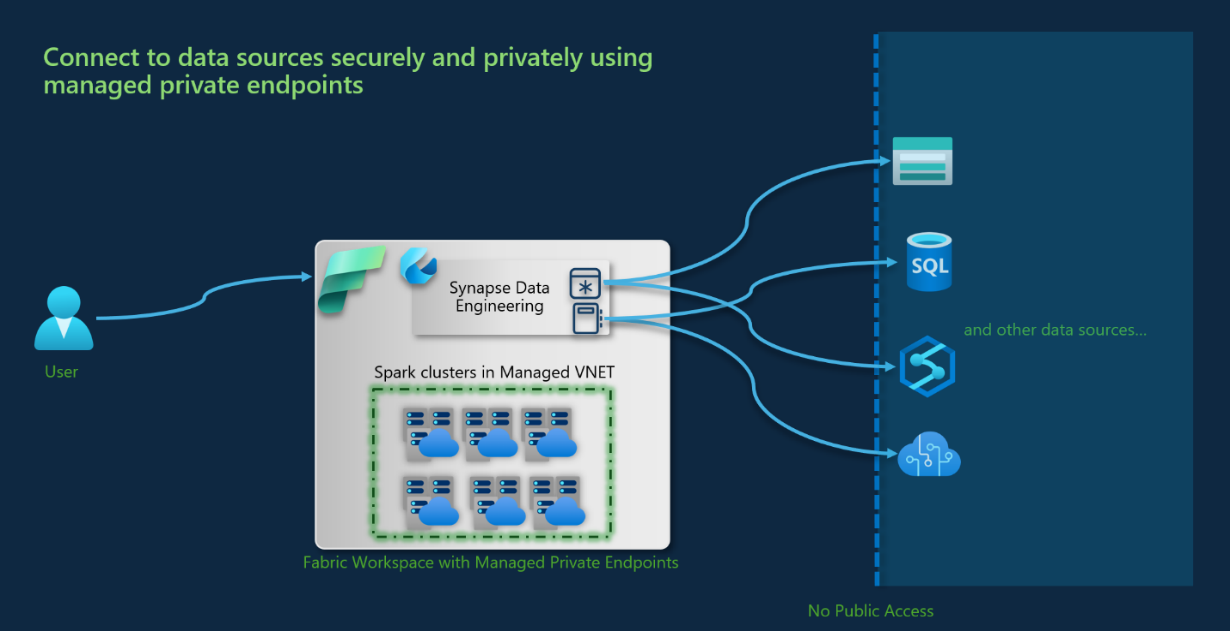
Workspaces with managed private endpoints have network isolation through a dedicated managed virtual network. These managed virtual networks (Managed VNETs) separate the Spark compute clusters from the shared virtual network and enable network security features such as private links and managed private endpoints. Microsoft Fabric takes care of the provisioning and management of the virtual networks and private endpoints, so users do not have to create or manage these network infrastructure resources themselves.
By just providing connection details, your managed private endpoint is instantly provisioned in the Managed VNET and a request for private endpoint access is submitted to the data source administrator for approval.
Users can track the status and approval process of the managed private endpoints from the Network security section of the Workspace settings.

Managed Private Endpoints support various data sources, including Azure Storage, Azure SQL Database, Azure Synapse Analytics, Azure Cosmos DB, Application gateway, Azure Key Vault, and many more.
Learn more about the data sources supported, please refer to our documentation Create and use managed private endpoints in Microsoft Fabric (preview) – Microsoft Fabric | Microsoft Learn
Note: Managed private endpoints are only supported for Fabric Trial capacity and Fabric capacities F64 or higher SKUs.
To learn more about the benefits, detailed steps of setup and limitations of managed private endpoints in Microsoft Fabric, please refer to our documentation Overview of managed private endpoints in Fabric.
To learn more about network isolation offered by managed virtual networks, please refer to Overview of managed virtual networks in Fabric.
Trusted Workspace Access for OneLake Shortcuts
Trusted workspace access allows you to securely access firewall-enabled Storage accounts. With Trusted workspace access, you can create OneLake shortcuts to Storage accounts, and then use the shortcuts in various Fabric items, such as Spark notebooks, SQL analytics endpoints, semantic models, reports, data pipelines, and dataflows Gen2.
Trusted workspace access is designed to help you securely and easily access data stored in Storage accounts from Fabric workspaces, without compromising on performance or functionality. You can leverage the power and flexibility of Fabric and OneLake to work with data in place without compromising on security.
How does Trusted workspace access work?
Trusted workspace access is based on the concept of workspace identity, which is a unique identity that can be associated with workspaces that are in Fabric capacities. When you create a workspace identity, Fabric creates a service principal in Microsoft Entra ID to represent the identity.
Workspace identity enables OneLake shortcuts in Fabric to access Storage accounts that have resource instance rules configured. Resource instance rules are a way to grant access to specific resources based on the workspace identity or managed identity. You can create resource instance rules by deploying an ARM template with the resource instance rule details.
To leverage Trusted workspace access in Fabric workspaces, you can create a OneLake shortcut in a Lakehouse, and provide the URL of the Storage account that has been configured with a resource instance rule. While creating the shortcut, you need to select organizational account or service principle for authentication and ensure that the principle used for authenticating to Storage has the appropriate Azure RBAC roles on the Storage account. Once the shortcut is created, you can use it in various Fabric items.
How to get started with Trusted workspace access?
Trusted workspace access is available for workspaces in Fabric capacities (F64 or higher). To get started with Trusted workspace access, you need to do the following steps:
- Create a workspace identity for your Fabric workspace if you don’t have one already. If you face issues with creation of the workspace identity, follow the troubleshooting guidelines provided here.
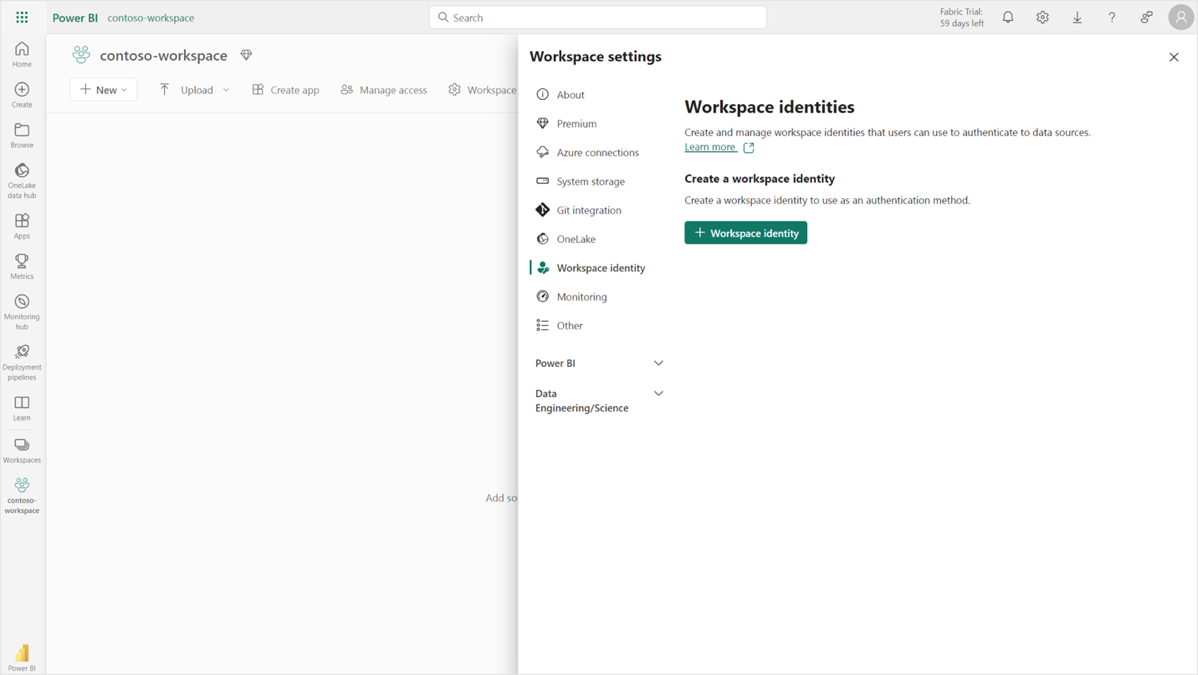
Create a workspace identity.
2. Configure resource instance rules for the Storage account that you want to access from your Fabric workspace. Follow the guidelines for configuring resource instance rules for Fabric workspaces here.
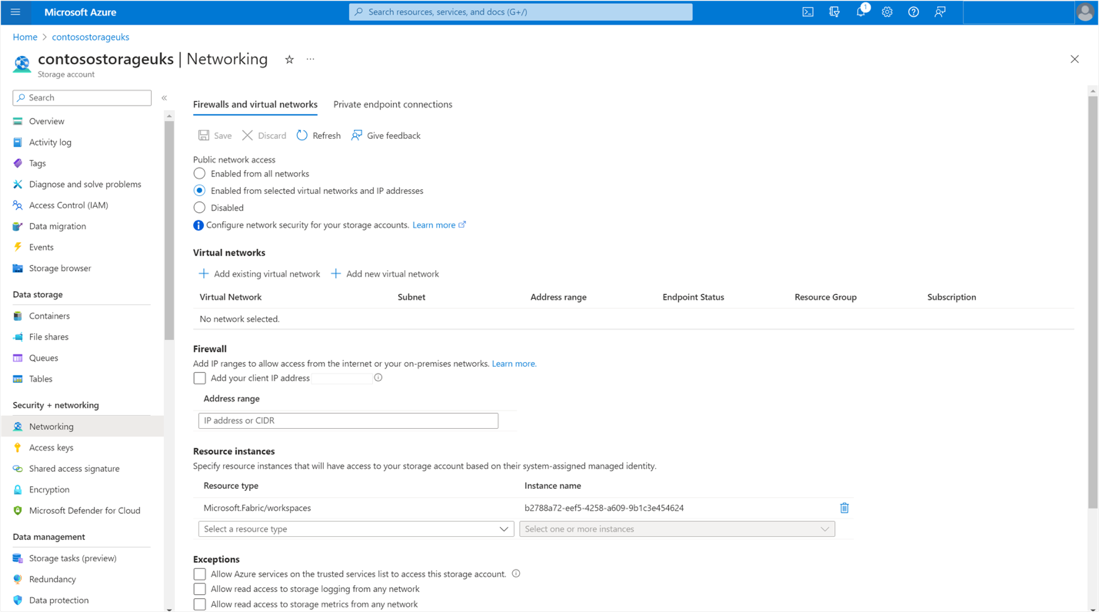
Resource instance rules in a Storage account
- Create a OneLake shortcut to the Storage account in a Lakehouse and select the organizational account or service principal option for authentication.
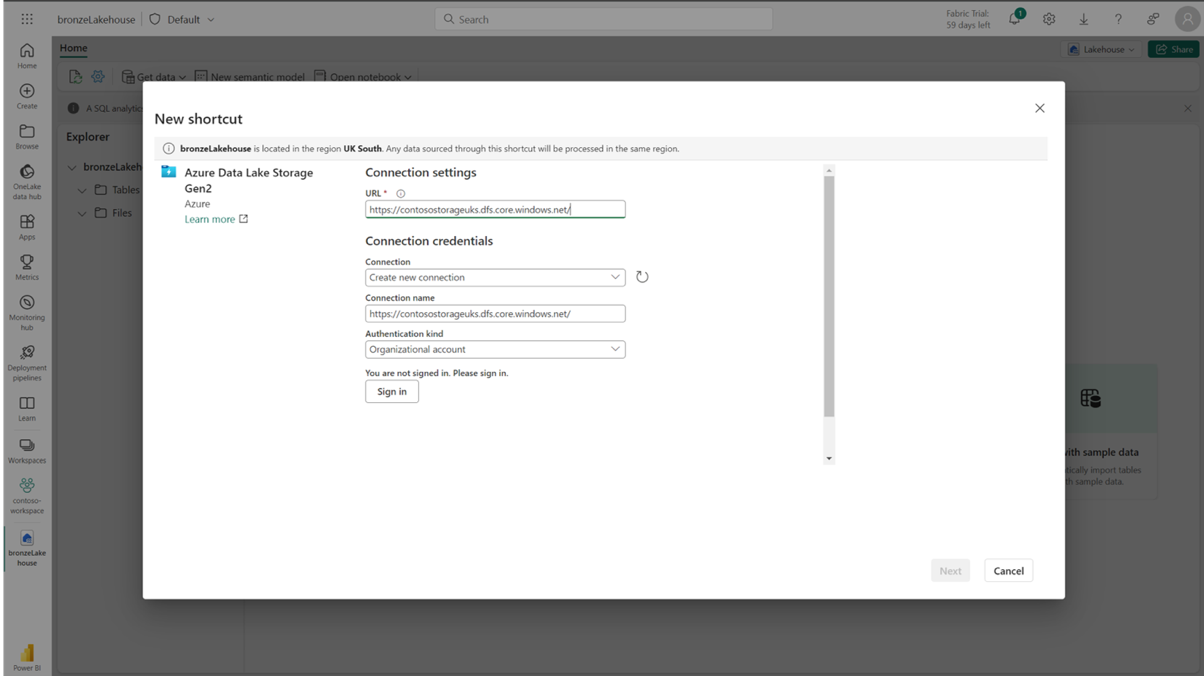
Create an ADLS g2 shortcut in a Lakehouse.
4. Use the OneLake shortcut in various Fabric items, such as Spark notebooks, SQL analytics endpoints, semantic models, reports, data pipelines, and dataflows Gen2.
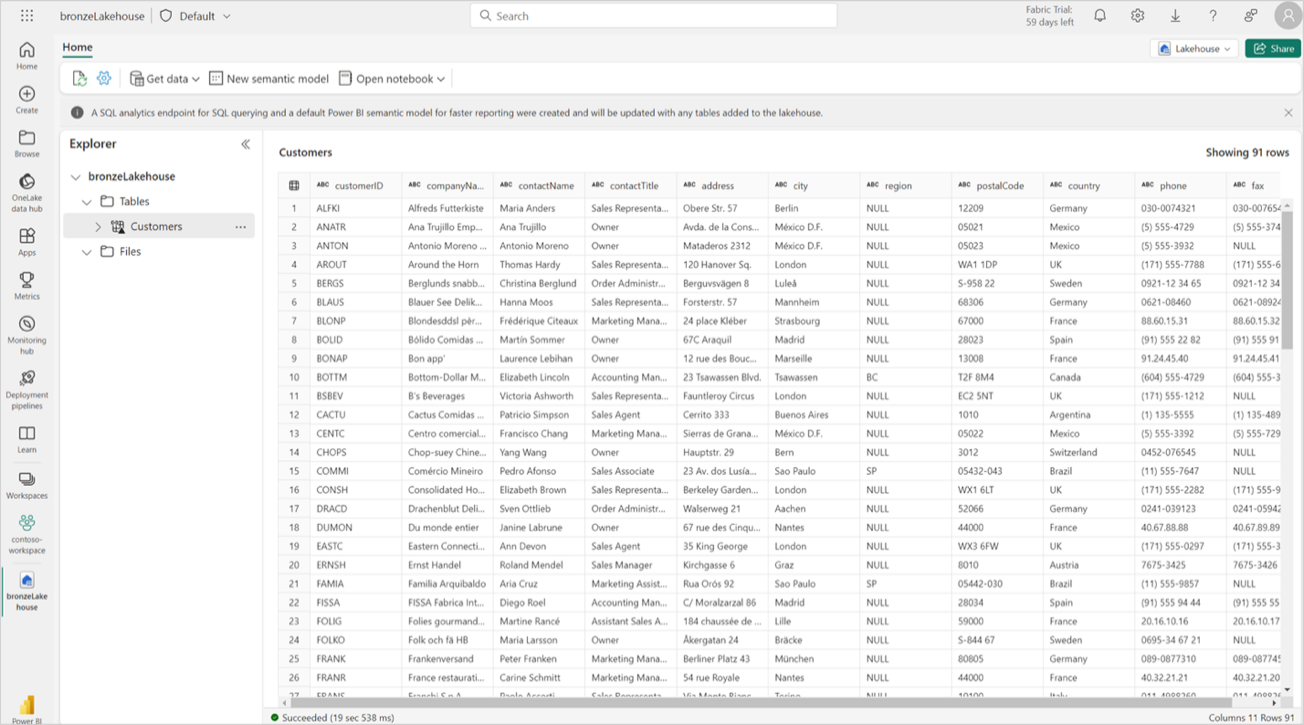
Access data stored in firewall-enabled Storage accounts through OneLake shortcuts.
For more details and guidance on how to use Trusted workspace access, please refer to the documentation links below.
Synapse
Data Warehouse
Git Integration
We are excited to announce the Git integration for the Warehouse! This feature allows you to check in the changes of your Warehouse into an Azure DevOps Git repository as a SQL database project. Git integration enables source control capabilities for developers to integrate their development processes, tools, and best practices directly into the Fabric platform.
Some scenarios that are enabled by Git:
- Backup and version development work
- Revert to previous stages
- Collaborate with others or work alone using Git branches
- Apply the capabilities of familiar source control tools to manage your Warehouse
- Commit changes
- Sync changes from Git
- Manage conflict resolutions
- …and many more!
Partition elimination performance improvement for tables with a large number of files
The SQL analytics endpoint of a Lakehouse uses partition elimination to read data from only those partitions that are relevant to the query. Recent improvements have boosted performance even more when queries are aimed at a few partitions in a table that has many files.
Mirroring (Public Preview)
We are thrilled to announce Mirroring in Fabric for Azure SQLDB, CosmosDB and Snowflake is in Public Preview!
Mirroring in Fabric allows users to enjoy a highly integrated, end-to-end, and easy-to-use product that is designed to simplify your analytics needs. Built for openness and collaboration between Microsoft, and technology solutions that can read the open-source Delta Lake table format, Mirroring is a low-cost and low-latency turnkey solution that allows you to create a replica of your Azure SQL DB, Snowflake or CosmosDB data in OneLake which can be used for all your analytical needs. Learn more
Data Engineering
Optimistic Job Admission for Fabric Spark
We are excited to announce a new feature for Fabric Spark: Optimistic Job Admission. This feature aims to reduce the frequency of throttling errors (HTTP 430: Spark Capacity Limit Exceeded Response) and improve the job admission experience for our customers, especially during peak usage hours.
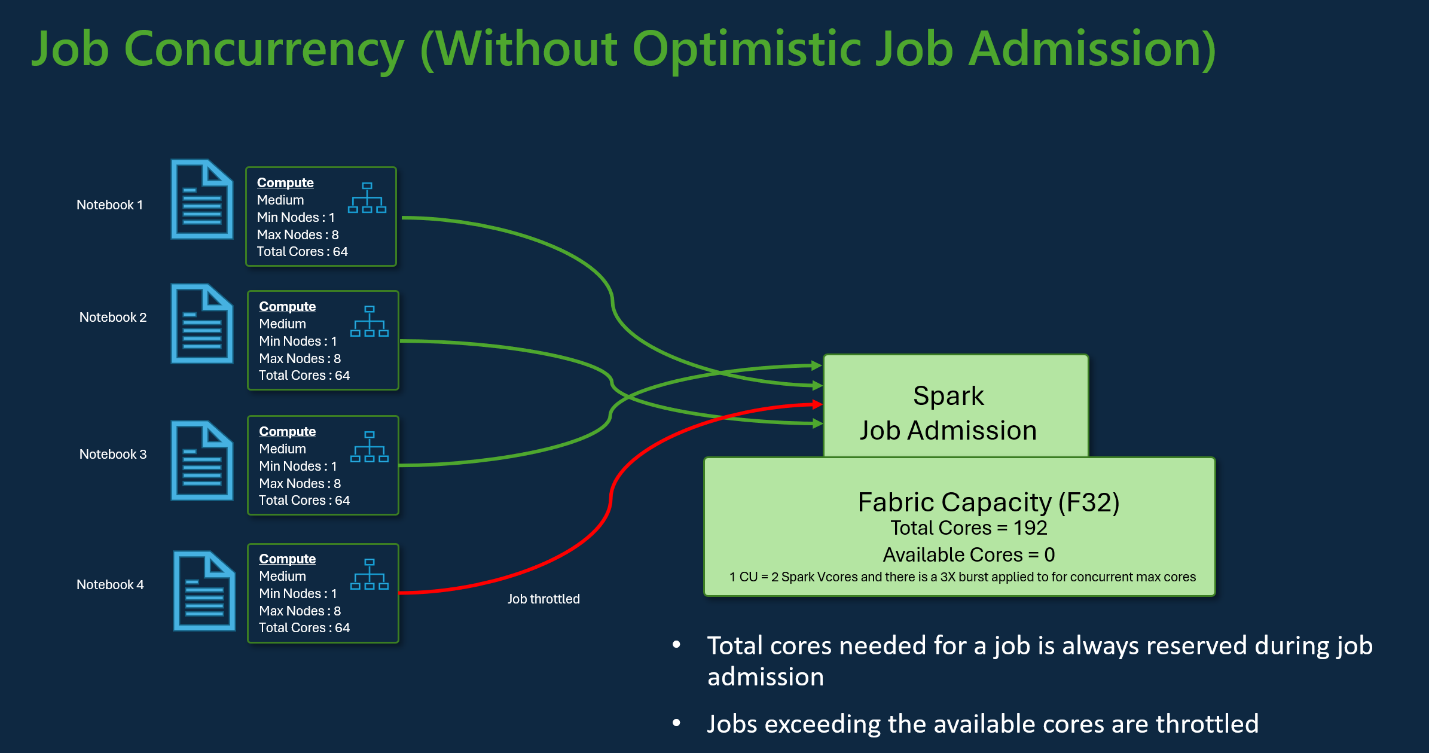
Throttling errors on Spark workload occur when the Spark usage exceeds the Fabric capacity limits. In the current job admission policy, Fabric Spark reserves the maximum number of cores that a job may need during its execution, based on the maximum number of nodes that the job can scale up to. This ensures that the job will always have enough resources to run, but it also limits the number of concurrent jobs that can be admitted in the cluster.
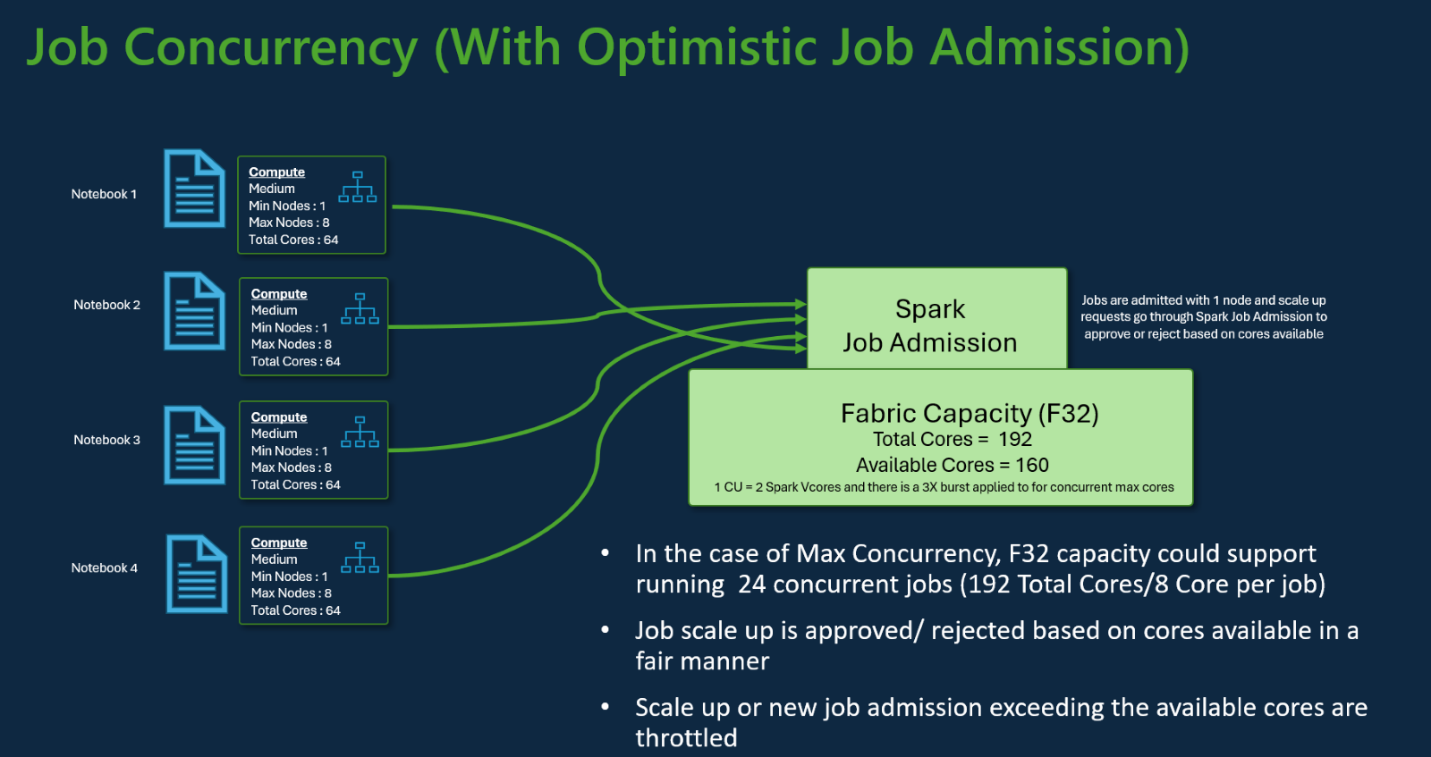
With Optimistic Job Admission, Fabric Spark only reserves the minimum number of cores that a job needs to start, based on the minimum number of nodes that the job can scale down to. This allows more jobs to be admitted if there are enough resources to meet the minimum requirements. If a job needs to scale up later, the scale up requests are approved or rejected based on the available cores in capacity.
Optimistic Job Admission can significantly increase the max number of concurrent jobs for our customers, especially for those who use large SKUs. For example, if a customer is using F32 SKU, which has 64 Spark VCores (Based on 1 CU = 2 Spark VCores) and 192 Max Burst Cores for concurrency (based on the 3X burst multiplier), they can only run 3 jobs concurrently in the current job admission policy, assuming they have the default starter pool configuration.
Now with Optimistic Job Admission, they can run up to 24 jobs concurrently with the same configuration. This is an 8x improvement!
We hope that this feature will help you run more jobs faster and more efficiently on Fabric Spark.
Single Node Support for Starter Pools
Do you hate waiting for your Spark sessions to start in starter pools with single node configuration? If yes, you will love the update on single node starter pool support. This feature lets you set your starter pool to max one node and get super-fast session start times for your Spark sessions. With this new support that’s been introduced, the system allocates the driver and executor with 4 cores each and 56 GB in memory, so that they fit within a single medium node configuration for Starter Pools. This improves session start times to 5 seconds in single node starter pool configurations.
How can you use it?
To use this feature, follow these steps:
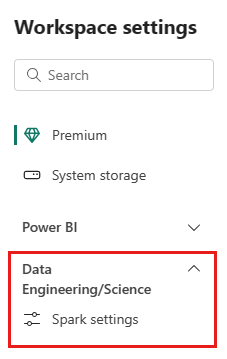
- Go to your Fabric workspace and choose the Workspace settings.
- Select the Data Engineering/Science option to expand the menu.
- Select the StarterPool option from the Pool selection and click on Edit.
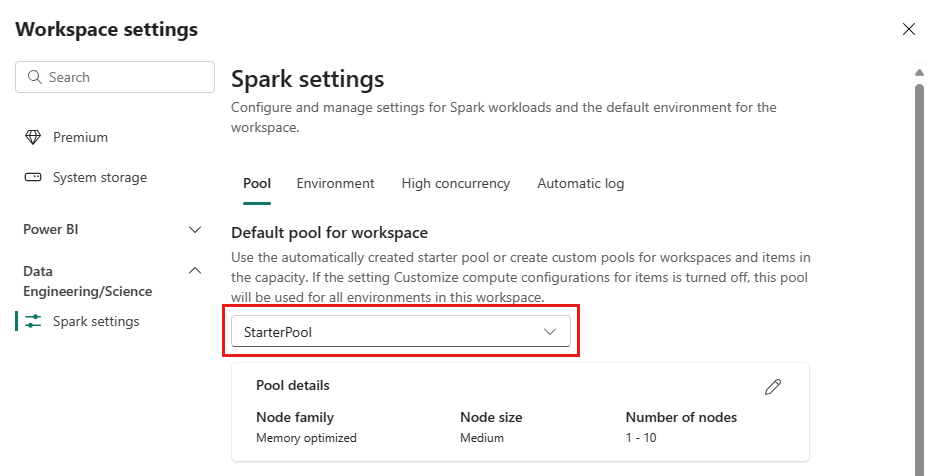
- Set the maximum node configuration for your starter pools to 1.
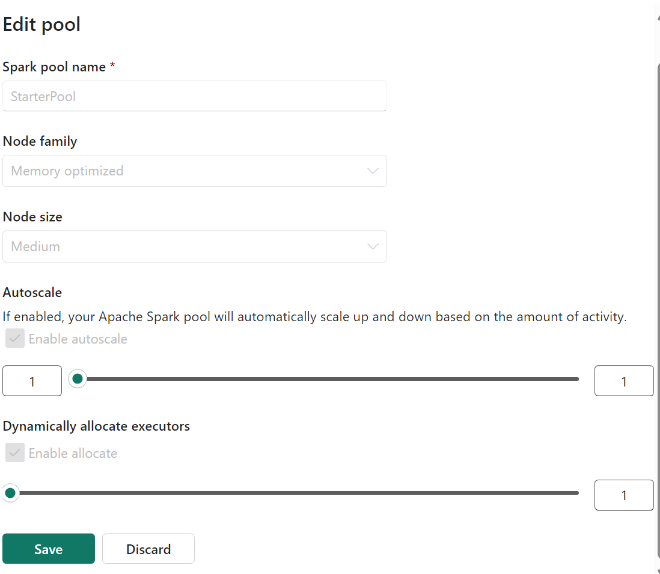
- Save your changes and enjoy super-fast session start times for your Spark sessions.
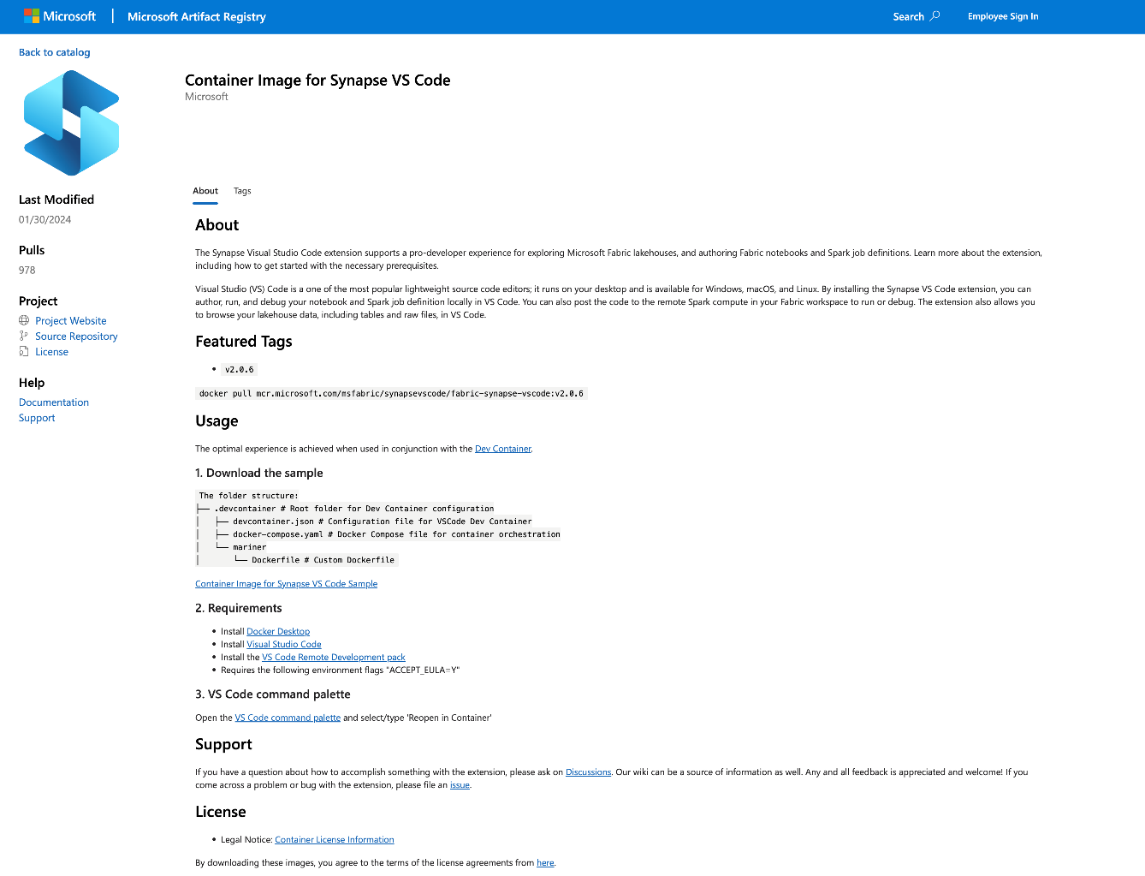
Container Image for Synapse VS Code
To simplify the development process for Synapse VS Code extension, we have released a container image that contains all the necessary dependencies for the extension (Microsoft Artifact Registry). This image is available in Microsoft artifact repository and can be pulled with a single command. By using this image, you do not need to install Java, Miniconda, or any other tools on your local machine. You can work on your Synapse projects inside the container environment, which is isolated and consistent.
We have also integrated the container image with VS Code dev container feature, which allows you to open a folder or a repository inside a container and use the VS Code editor and extensions as usual. To use this feature, you need to install the Remote – Containers extension and create a devcontainer.json file in your project folder. We have provided a sample devcontainer.json file that you can use as a template or customize according to your needs (SynapseVSCode/samples/.devcontainer at main · microsoft/SynapseVSCode (github.com)). The dev container feature will automatically pull the container image, mount your project folder, and launch the VS Code editor inside the container. You can then enjoy the full functionality of the Synapse VS Code extension without any hassle.
Git Integration with Spark Job Definition
We are excited to announce the Git integration for Spark Job Definition artifacts. This feature allows you to check in the changes of your Spark Job Definitions into a Git repository, which will include the source code of the Spark jobs and other artifact properties. By using Git as a version control system, you can track the history of your Spark Job Definitions, collaborate with other developers, and implement CI/CD workflows for your Spark projects.
The Git integration for Spark Job Definition artifacts is designed to enhance your development experience and enable CI/CD scenarios for your Spark projects. We hope you find this feature useful, and we welcome your feedback and suggestions.
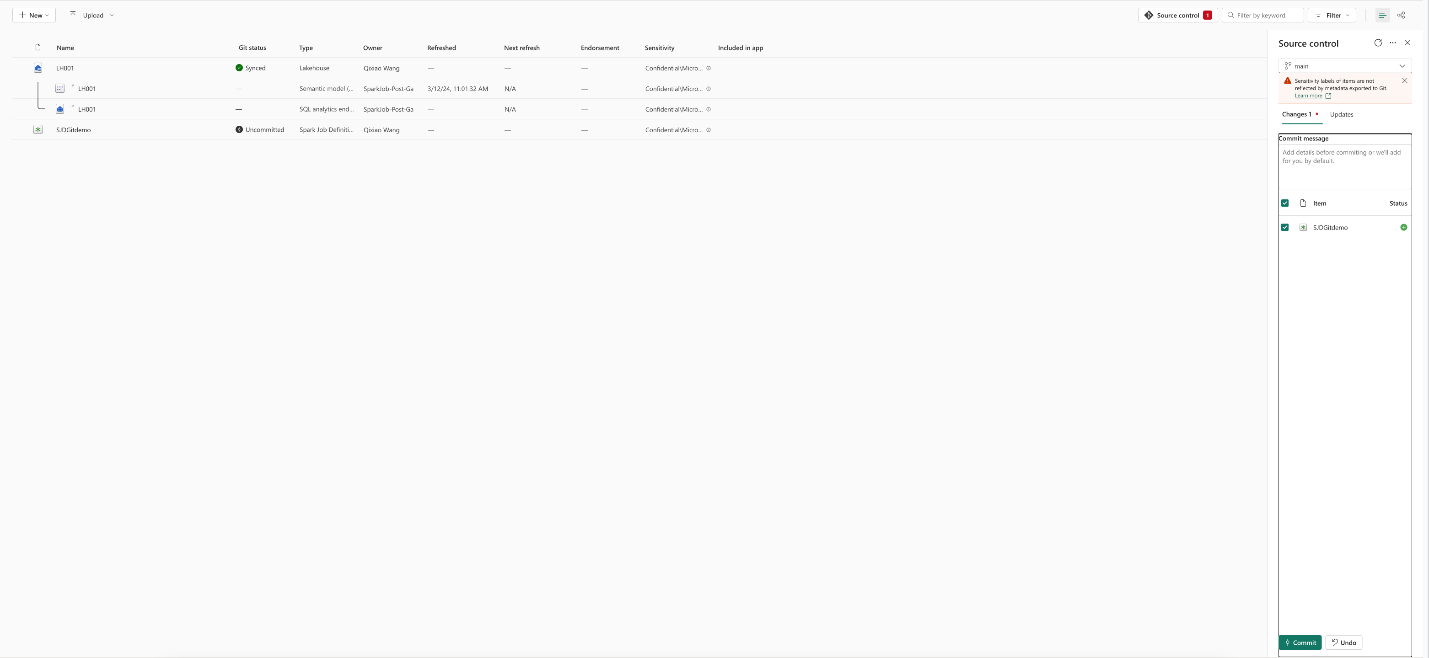
When a new Spark Job Definition is made with a PySpark script as the main definition file, the Git status shows that this is an unsaved change that needs to be committed.
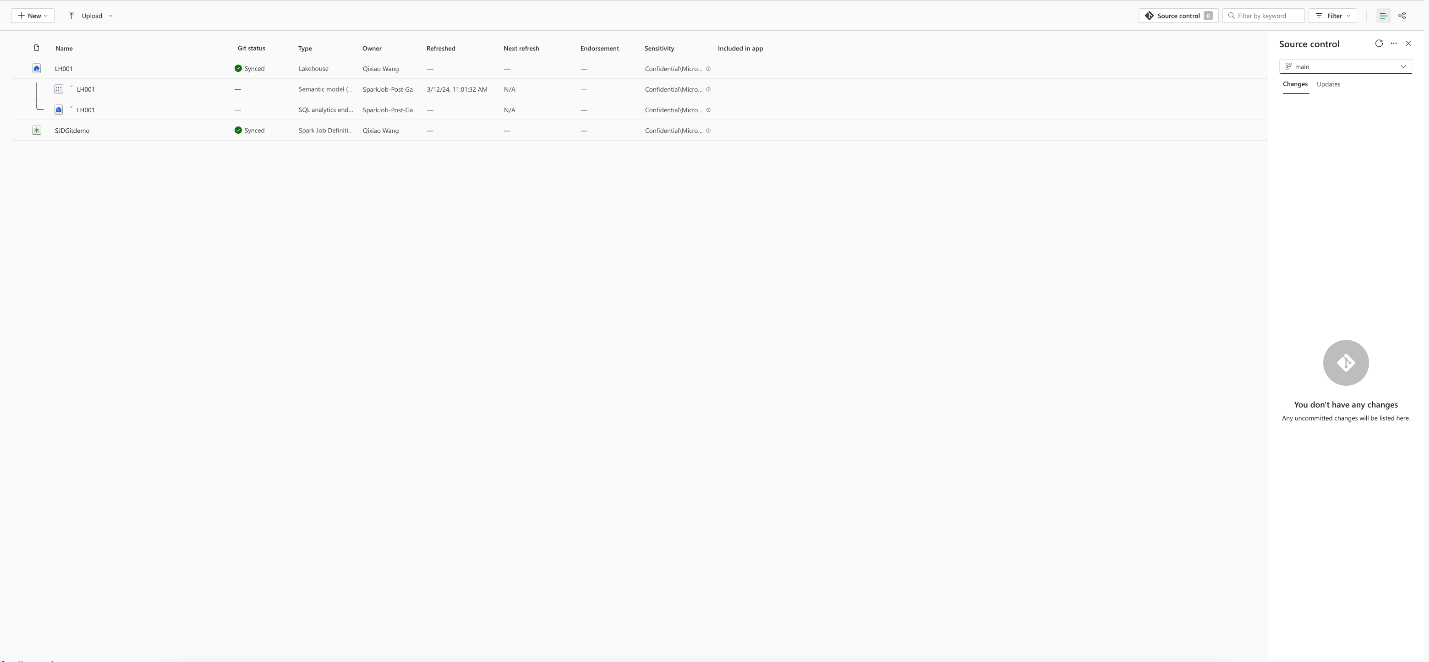
Once the change is finalized mich
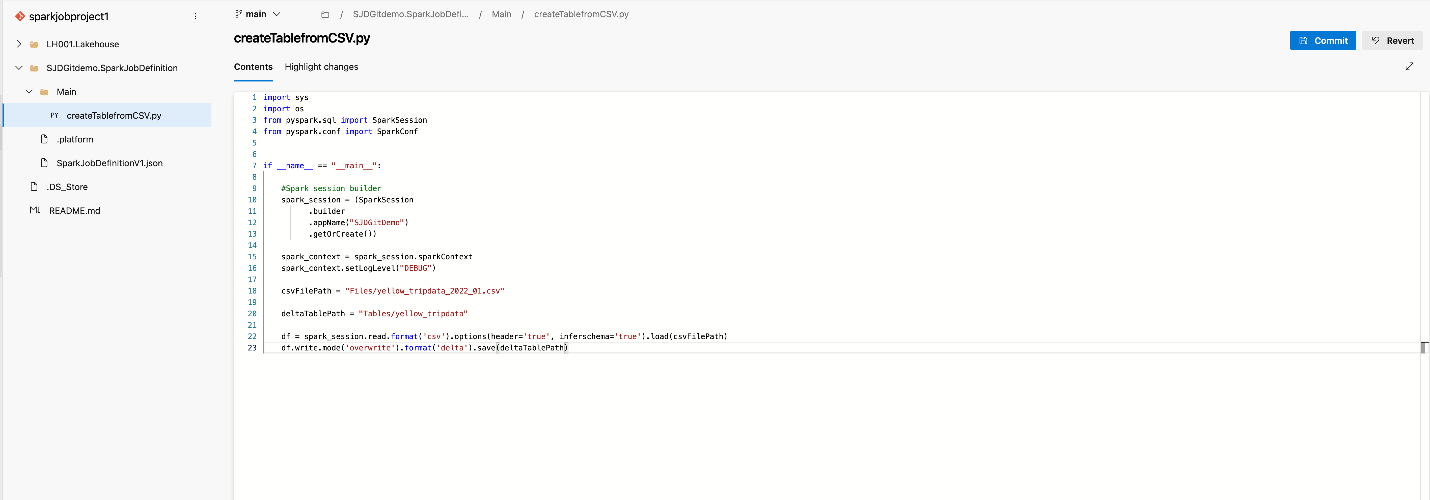
The structure of the linked git repository and the file containing the source code that was submitted.
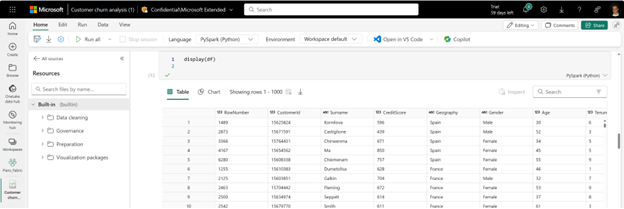
New Revamped Object Explorer experience in the notebook
We are excited to announce the release of a revamped object explorer experience. The new experience is designed to improve flexibility and discoverability of data sources in the explorer and improve the discoverability of Resource folders.
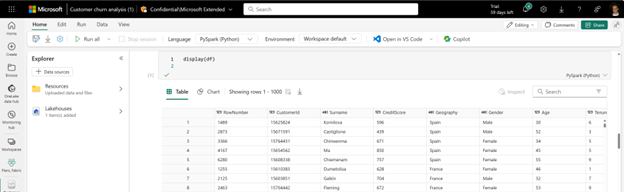
Try it out and add new Data sources clicking on the +Data sources button and upload new modules or create folders by clicking on the Resources folder and let us know what you think.
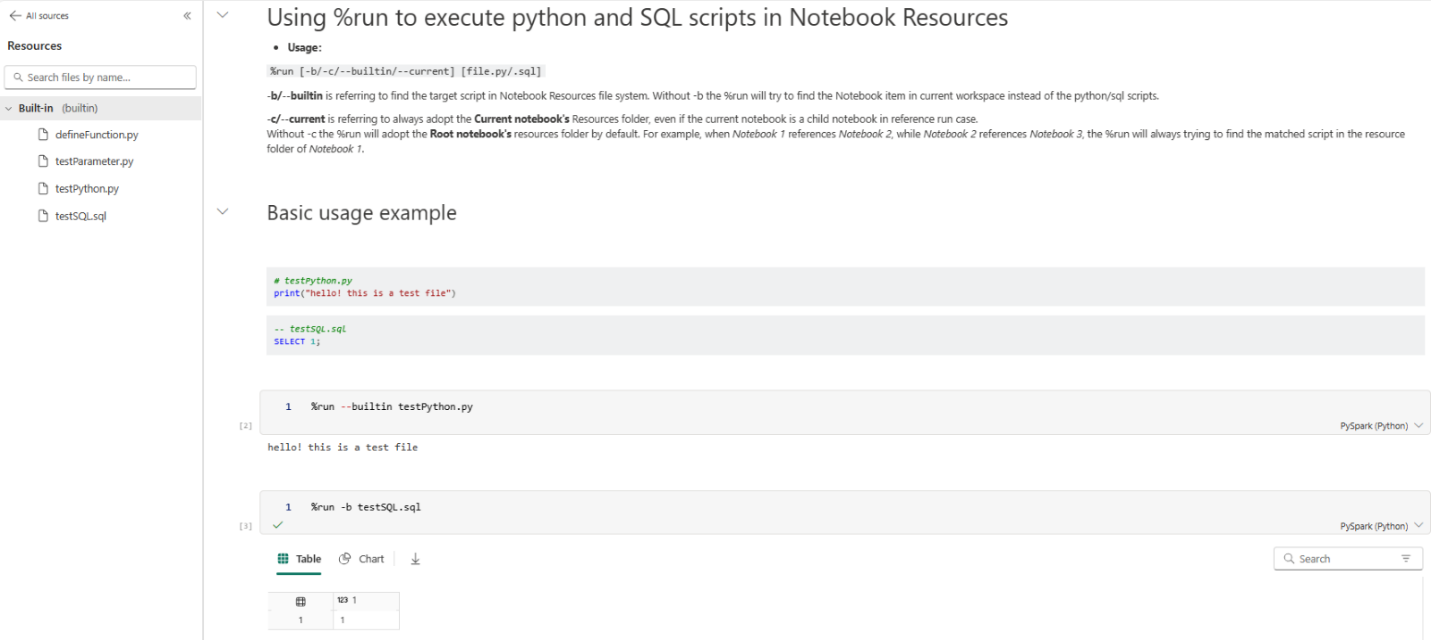
%Run your scripts in Notebook
Now you can use %run magic command to run your Python scripts and SQL scripts in Notebook resources folder, just like Jupyter notebook %run command. By this way you can easily reuse common modules that developed from your local IDE and use them in your Fabric Notebooks conveniently. We also introduced different command parameters to make sure complex cases such as reference run and high concurrency mode can be covered without friction, stay tuned for the best practice example for the usage!
Data Science
Semantic Link is now GA!
Semantic links are now generally available! The package comes with our default VHD, you can now use Semantic link in Fabric right away without any pip installation. Check it out.
Capacity level delegation for AI and Copilot
We introduced a new feature in December 2023 that allows tenant admins to enable AI and Copilot in Fabric for certain security groups in addition to the entire organization. Today, we are excited to announce that you can enable AI and Copilot for a specific Capacity. You can test Copilot at a certain capacity without impacting other workloads. This allows you to adapt Copilot to meet the needs of different groups in your organization and manage your capacity more effectively.
EU customers can use AI and Copilot without cross-geo setting
AI and Copilot in Fabric are powered by large language models that are only available in limited datacenters. Previously, users who were not in US and France had to turn on the cross-geo setting to use AI and Copilot. Since mid-March, we updated the cross-geographic mapping logic, EU customers can use AI and Copilot without turning on the cross-geo setting, and their AI and Copilot requests will be processed within EUDB. Check it out!
Real-time Analytics
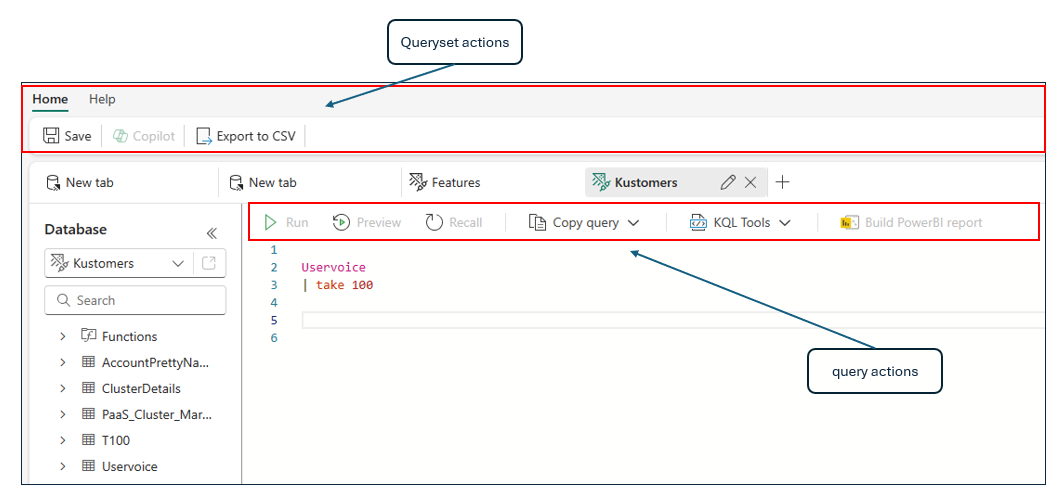
New KQL Queryset Command Bar
Finding the commands for the actions you are trying to perform just got easier with our latest update to the KQL Queryset. Now, it’s easy to distinguish between actions applicable at the Queryset level and the single query level.
Introducing a secondary command bar within the query editor dedicated to hosting query-level actions. Enjoy smoother navigation and streamlined functionality for a more efficient querying experience.
New Update Command Public Preview
The new update command is now in public preview!
This allows you to update existing records in a Kusto Table. This can be useful to fix ad hoc data issues or be integrated into a data loading pipeline. The command has a “what if” mode to try a command before running it on your data.
.update table Employees on Id <|
MyStagingTable
| where true
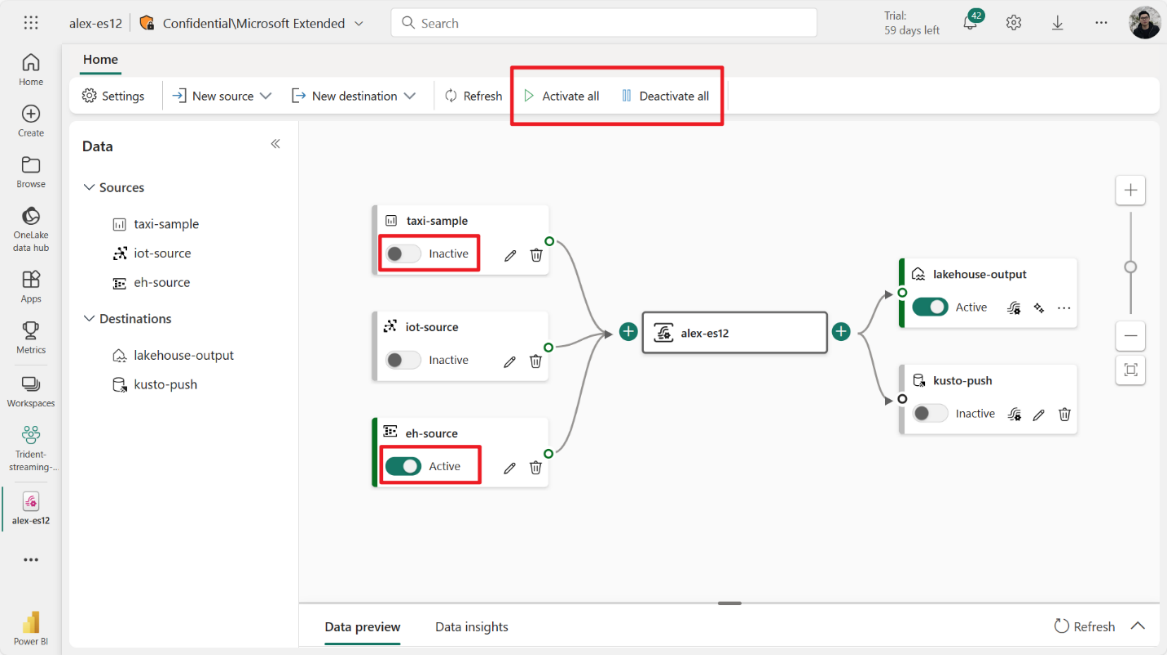
Introducing Pause and Resume Feature in Eventstream
We’re excited to introduce a powerful new feature in Fabric Eventstream: The Pause and Resume Feature. This powerful capability empowers you with unprecedented control over your data streams, enabling you to pause data streaming from various sources and destinations within Eventstream. You can then resume data streaming seamlessly from the paused time or a customized time, ensuring no data loss.
Key Features:
- Activate/Deactivate All: You can quickly pause and resume all data traffic flowing in and out of Eventstream with the Activate All and Deactivate All options on the menu bar.
- Toggle Switch Button: Each node has a convenient toggle switch button, allowing you to activate or deactivate any data source from streaming in or out of Eventstream with ease.
With the Pause and Resume feature in Fabric Eventstream, you can pause traffic from specific sources and destinations whenever needed. Whether it’s for troubleshooting purposes, building proof-of-concepts with test data, or minimizing unnecessary data processing costs, this feature offers unparalleled control over your data streams and leads to more efficient resource allocation.
Fabric Real-Time Analytics Integrates with Newly Announced Database Watcher for Azure SQL (preview)
Azure SQL family users can now take advantage of an enhanced monitoring solution for their databases and leverage Microsoft Fabric integration. With the introduction of the new Database Watcher for Azure SQL (preview), users gain access to advanced monitoring capabilities. Through integration with Microsoft Fabric, they can effortlessly stream, store, and analyze monitoring data in real-time using an Eventhouse database in Fabric Real-Time Analytics. This integration enables users to stay informed about their database performance and make timely, informed decisions.
Database watcher is a new managed monitoring solution for database services in the Azure SQL family. It supports Azure SQL Database and Azure SQL Managed Instance.
Database watchers collect in-depth workload monitoring data to give you a detailed view of database performance, configuration, and health. Monitoring data from the databases, elastic pools, and SQL managed instances you select is collected in near real time into a central data store. To store and analyze SQL monitoring data, database watcher uses an Eventhouse database in Fabric Real-Time Analytics (as a complement option, Azure Data Explorer is also supported).
Dashboards in Azure portal provide a single-pane-of-glass view of your Azure SQL estate and a detailed view of each database, elastic pool, and SQL managed instance.
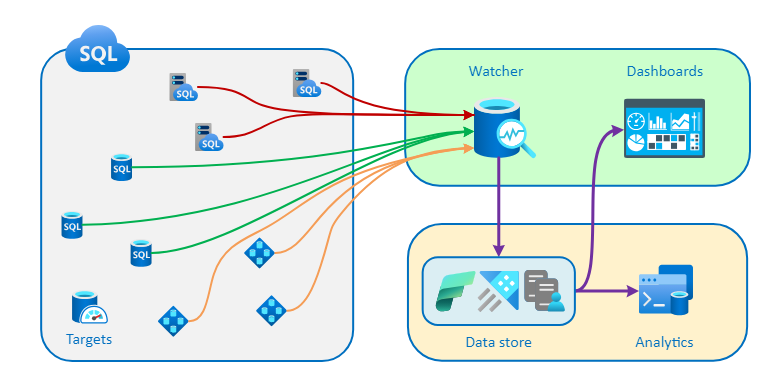
A conceptual diagram of a database watcher deployment, showing the flow of monitoring data from Azure SQL resources to a database watcher.
The monitoring data is stored in Fabric Real-Time Analytics.
Dashboards in the Azure portal show you a single-pane-of-glass view across your Azure SQL estate, and a detailed view of each database, elastic pool, and managed instance.
You can query data in your Eventhouse database in Real-Time Analytics using KQL or T-SQL, analyze and model your data using Real-Time Analytics Querysets or Fabric Notebooks, build custom visualizations using KQL built-in visualizations or Power BI.
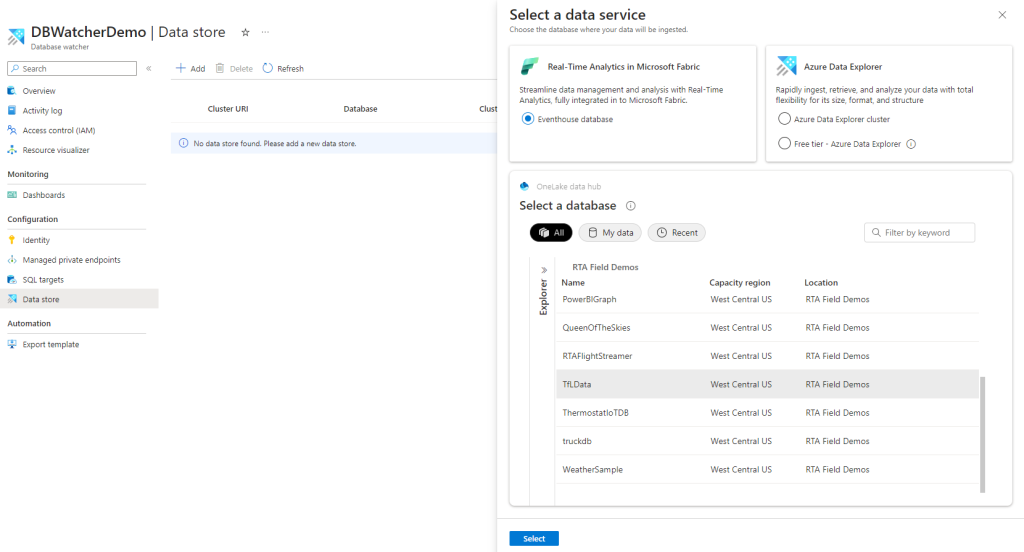
From the DB Watcher resource page in Azure, you can easily select an Eventhouse DB in Fabric Real-Time Analytics and stream the data to it. Selecting a database is done using the Fabric One Lake data hub interface.
To analyze collected monitoring data, the recommended method is to use KQL. KQL is optimal for querying telemetry, metrics, and logs. It provides extensive support for text search and parsing, time-series operators and functions, analytics and aggregation, and many other language constructs that facilitate data analysis. You can find examples of analyzing database watcher monitoring data with KQL in the documentation.
Summary
The dashboards, complemented by KQL queries, enable you to delve deep into the performance and configuration of your databases. This means you can detect, investigate, and troubleshoot a wide variety of database performance and health issues.
Whether you’re tackling resource bottlenecks or fine-tuning your Azure SQL resources for the best balance of cost and performance, Database Watcher equips you with the insights needed to make informed decisions. It’s your pathway to optimizing your Azure SQL setup for peak efficiency and cost-effectiveness.
Next steps
One effective approach to grasp the potential and the power of Database Watcher is to give it a try yourself. Set up your Azure SQL resources with Database Watcher, explore the dashboards, and start running some queries with KQL.
To read more about Database Watcher, check out the documentation.
Data Factory
Dataflows Gen2
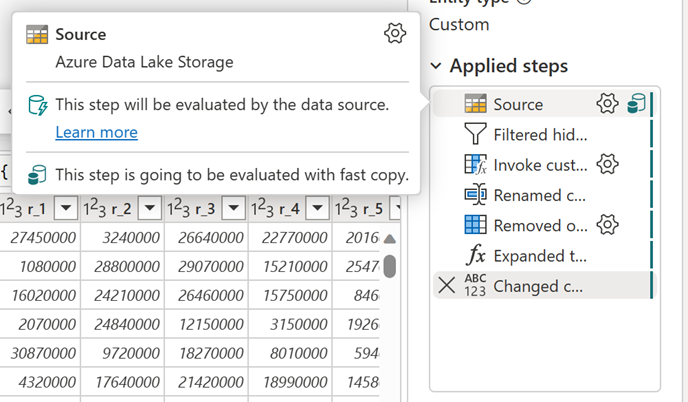
Fast copy
Dataflows help with ingesting and transforming data. With the introduction of dataflow scale out with the SQL DW compute, we are able to transform your data at scale. However, to do this on a scale, your data needs to be ingested first.
With the introduction of fast copy, you can ingest Terabytes of data with the easy experience of dataflows, but with the scalable back end of Pipeline’s Copy Activity.
Service Principal Name authentication kind support for On-Premises and VNET data gateways
We released support for Azure Service Principals (SPN) as an authentication kind last year. Now we’ve added support for this new authentication kind for on-premises data gateways and VNET data gateways.
Azure service principal is a security identity that is application based and can be assigned permissions to access your data sources. Service principals are used to safely connect to data, without a user identity. Learn more about service principals.
You can learn how to leverage the service principal authentication kind from the documentation available and leverage this in multiple connectors such as Azure Data Lake Storage, Dataverse, Azure SQL database, Web connector and more.
Certified connector updates
We’re pleased to announce the new and updated connectors in this release:
- [New] Topcon Aptix Insights
- [Update] BitSight Security Ratings
- [New] Zendesk Data
- [Update] Planview OKR
- [Update] BQE Core
- [New] LinkedIn Learning
- [New] LEAP
- [New] Samsara
- [Update] Celonis EMS
- [New] Supermetrics
- [New] Exact Online Premium
Are you interested in creating your own connector and publishing it for your customers? Learn more about the Power Query SDK and the Connector Certification program.
Data pipelines
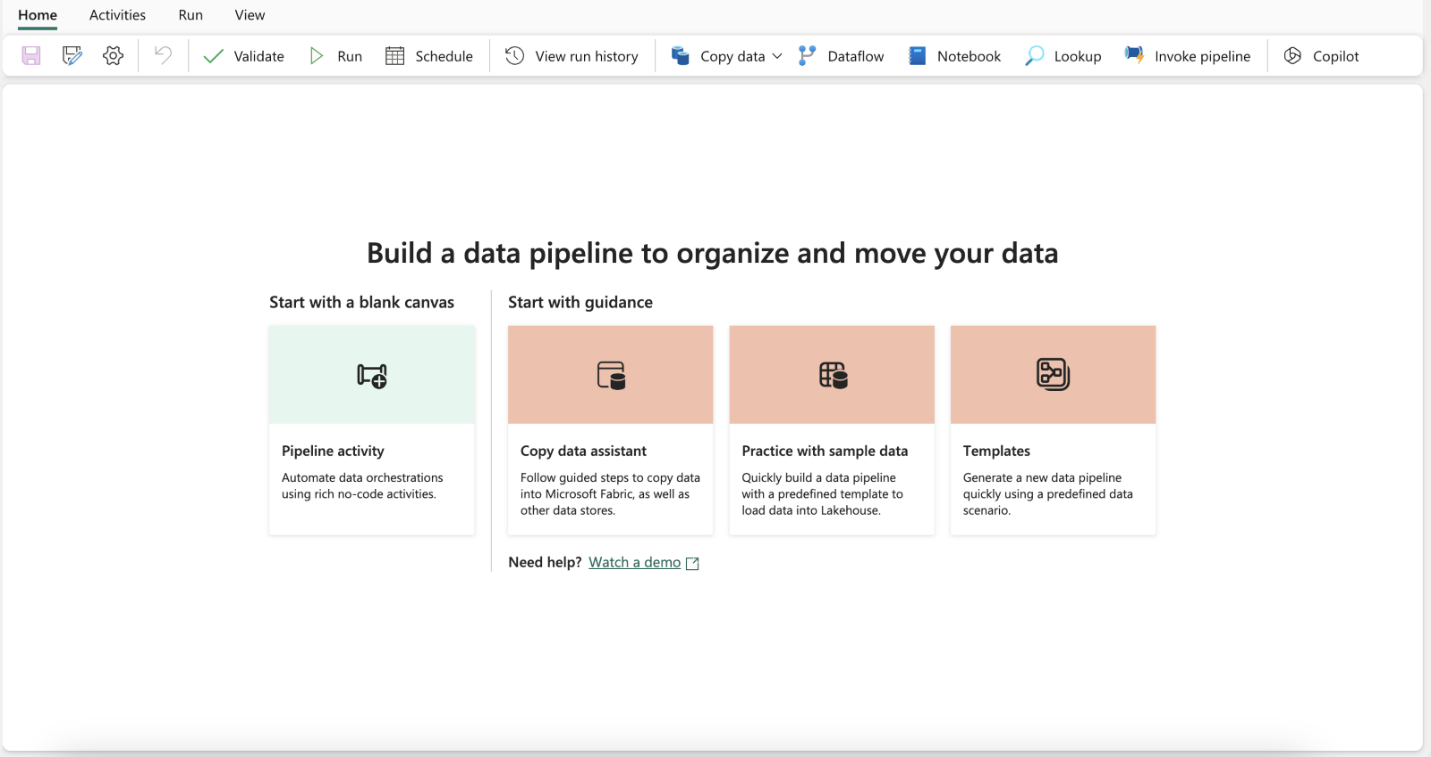
Updated Fabric data pipeline homepage
The Data pipeline homepage is now updated with an all-new look! You’ll now find new guidance cards to help you find what you’re looking for more quickly.
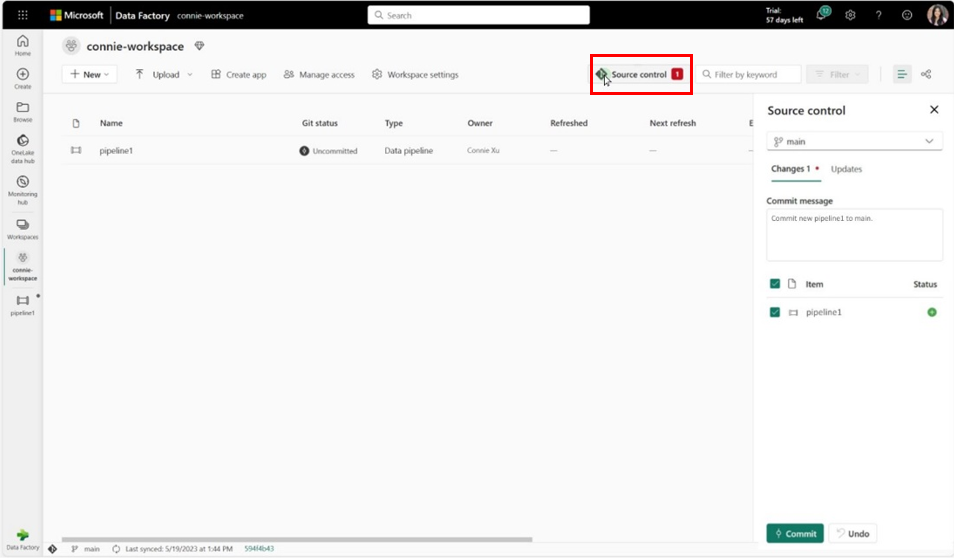
Pipeline support for CI/CD in public preview
When developing workflows with Data Factory’s pipelines it is very important for developers to be able to save their work in a Git repository for versioning, source control, and CI/CD. We are happy to announce the public preview of CI/CD support for Data Factory pipelines! Now, you can connect your Azure DevOps (ADO) projects to your Fabric workspace and commit, merge, and branch your pipelines using Fabric’s Git integration. Additionally, you can now use the built-in Deployment Pipelines inside Fabric to assign workspaces to different environments (dev, test, prod) and promote your changes easily without using ADO!
Data Factory Data Pipelines APIs
You can now use our public APIs to create, execute, and monitor data pipelines in Fabric Data Factory.
Increase in Pipeline activity limit
As a cloud service for analytics workflows, the Data Factory team has had a limit of 40 activities per pipeline since the early days of Azure Data Factory. The same orchestration engine drives Fabric Data Factory data pipelines and we’ve reacted to your feedback that many times you need more than 40 activities in a pipeline to perform complex workflows that require error checks, branching, and other control flow capabilities. We’ve now updated the limits for the Data Factory pipeline service in both Fabric and Azure (Azure Data Factory & Synapse pipelines) to now allow up to 80 activities per pipeline.
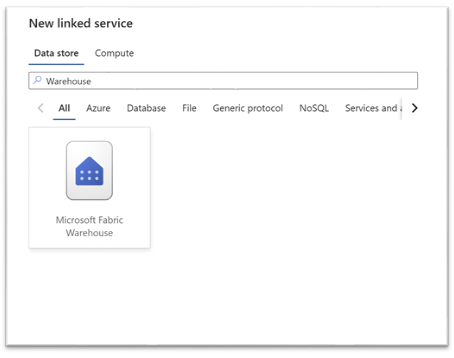
Fabric Warehouse in ADF copy activity
We’re excited to announce that you can now connect to your Fabric Warehouse from Azure Data Factory/Synapse pipeline. You can find this new connector when creating a new source or sink destination in your copy activity.
This connector is also supported in the Lookup activity, Stored Procedure activity, Script activity, and Get Metadata activity.
Edit column type to destination table support added to Fabric Warehouse and other SQL data stores
When moving data from any supported data sources into Fabric Warehouse or other SQL data stores (SQL Server, Azure SQL Database, Azure SQL Managed Instance; Azure Synapse Analytics) via data pipelines, users can now specify the data type for each column under the destination table, as well as customize the precision and scale to certain data types such as decimal, numeric, etc.
SFTP: performance improvements when writing data to SFTP
SFTP connector has been improved to offer better performance when writing to SFTP as destination.