Visualize and Explore Data with Real-Time Dashboards


In today’s data-driven world, the ability to quickly explore, analyze, and derive insights from fresh, high granularity data is paramount. With the ever-increasing volume and complexity of data, organizations need powerful tools that not only streamline data exploration but also provide real-time insights. That’s why we’re thrilled to announce the public preview of Real-Time Dashboards, that empower users to interact with their data dynamically and in real time.
Unveiling Real-Time Dashboards
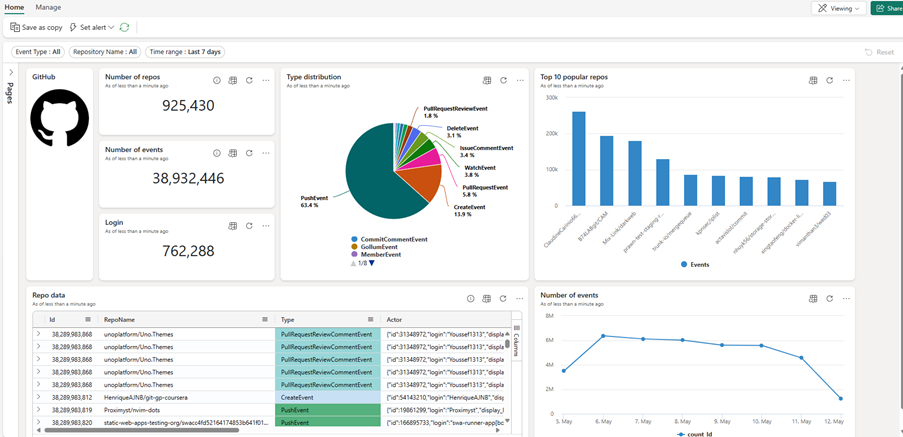
At its core, each Real-Time Dashboard is a collection of tiles, organized in pages, where each tile corresponds to an underlying query and a visual representation. With extensive slice and dice features, and advanced exploration capabilities, Real-Time Dashboards not only provide dynamic, real-time access to fresh data, but also empower you to make informed decisions and gain insights on-the-fly.
Advanced Visualization Options
One of the highlights of Real-Time Dashboards is the rich portfolio of visualization types available. From traditional bar and line charts to sophisticated anomaly detection and map visuals, Real-Time Dashboards provide a comprehensive toolkit for creating lightweight, scalable and compelling data representations. What’s more, you can customize these visuals with conditional formatting rules, making it easier to identify significant data points at a glance.
Real-Time Interaction and no-code exploration
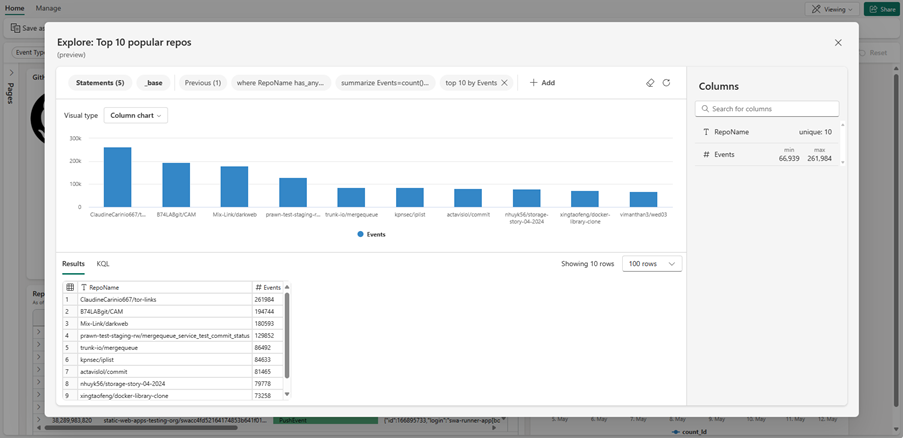
Real-Time Dashboards aren’t just about static data representations; they enable dynamic interaction and collaboration. With features like parameters, cross filters, and drill through capabilities, users can slice and dice data, filter visuals, and gain different viewpoints effortlessly.
With a friendly UI, users gain the critical ability to seamlessly drill down from any visualization to examine the specific data points behind it, ensuring transparency and eliminating “cliffs” in analysis. This intuitive, no-code UI empowers users of all levels to delve deep into their data, down to the level of individual events, without the need for specialized KQL expertise.
Streamlined Visualization Creation
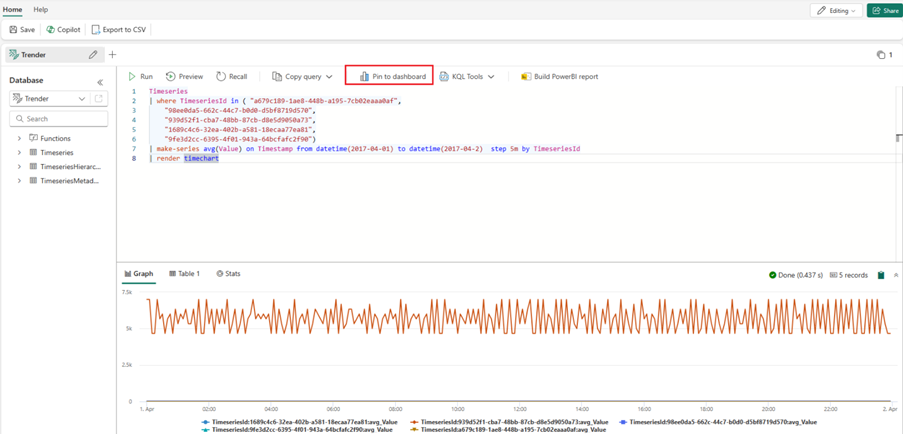
Real-Time Dashboards revolutionize the way visualizations are created. With the ability to effortlessly export Kusto Query Language (KQL) queries from any KQL Queryset, to dashboards as visuals, authors can quickly assemble compelling representations of their data. What’s more, the user-friendly tile authoring experience empowers users to modify visuals with ease, ensuring that every dashboard is tailored to meet their specific needs.
When to use Real-Time Dashboards?
Real-Time Dashboards natively visualize data stored in Eventhouses, making them the preferred choice for timestamped, fast-flowing, high-volume data with JSON or detailed text elements, leveraging Eventhouse’s capabilities for low-latency data availability and flexible querying.
They stand out with their streamlined approach, focusing on functionality based on KQL queries, offering a leaner overhead and real-time query capabilities. They are ideal for scenarios where immediate data access and exploration are needed, particularly in environments where KQL expertise is prevalent. On the other hand, Power BI (PBI) provides a comprehensive feature set and rich visualization options, making it suitable for scenarios requiring complex parameterization, and broad sharing capabilities. Choose Real-Time Dashboards for real-time insights and agile exploration with KQL proficiency, while opting for PBI when diverse data sources, and extensive customization are priorities.
To read more about setting Real-Time Dashboards, check out the documentation.
To find out more about Real-Time Intelligence, read Yitzhak Kesselman’s announcement. As we launch our preview, we’d love to hear what you think and how you’re using the product. The best way to get in touch with us is through our community forum or submit an idea. For detailed how-tos, tutorials and other resources, check out the documentation.
This is part of a series of blog posts that dive into all the capabilities of Real-Time Intelligence. Stay tuned for more!