Microsoft Fabric Event Streams: Generating Real-time Insights with Python, KQL and Power BI


In the Age of AI (artificial intelligence), the ability to analyze, monitor and act on real-time data is becoming crucial for companies that wish to remain competitive in their industries. This increasing demand for real-time insights has led to the necessity for a fully managed service capable of handling high volumes of data ingestion and transformation with sub-second or millisecond level latency.
Microsoft recently announced the Public Preview of Microsoft Fabric event streams, a high-throughput, low-latency data ingestion and transformation service. Its SaaS-like experience makes it easy for business users to gain insights in near-real time without having to worry about complex provisioning and operational steps. With event streams, enterprises can ingest data from a variety of sources like IOT (internet of things) devices, Clickstreams, Logs, change data captures from Databases etc. This data can then be transformed, enriched, and ultimately written into OneLake and PBI dashboards etc. All of this with just a few clicks using a no-code experience built into the Microsoft Fabric portal.
In this blog, we will demonstrate the ease with which you can ingest data from almost any data source into Microsoft Fabric with just minimal knowledge of Python (and APIs to the data source). You can then take advantage of the low-code/no-code experience of Fabric Eventstreams to push the data in to a KQL Database and build a real-time report using Power BI.
Coastal Water Level and Current Monitoring with Microsoft Fabric event streams

The NOAA’s Center for Operational Oceanographic Products and Services (CO-OPS) provides real-time information on tides, water levels, currents, and other coastal oceanographic and meteorological data. This data serves a crucial purpose in aiding the maritime transportation industry by ensuring safe and efficient navigation through waterways and ports. In addition, current trends and predictions play a significant role in assisting individuals in preparing for potential flooding due to storms, tsunamis, and sea level fluctuations.
In this example, we will collect the water level, wind speed, current speed and water level prediction from CO-OPS to develop a simplified version of a real-time dashboard that can be used by boaters to decide route and arrival estimations.
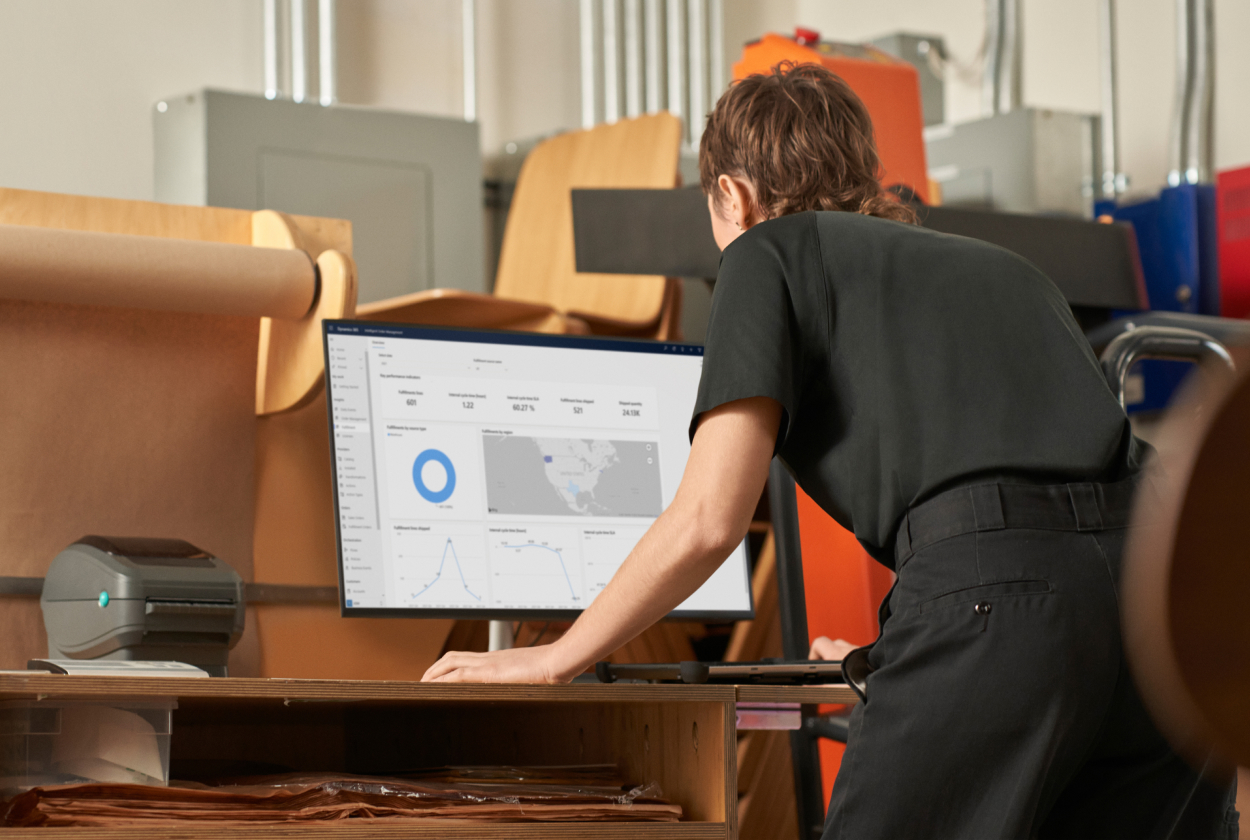
Here is the dashboard that we are going to build together:
Pre-requisites
Before you get started, make sure that you have taken the below steps:
- Get access to a premium Microsoft Fabric workspace with Contributor or above permissions.
- Python 3.7 or later, with pip installed and updated.
- Install azure-eventhub and asyncio packages must be installed (details are here)
Collecting Coastal Water Level and Atmospheric Data with Python
NOAA provides real-time water level information that is updated every 6 minutes. You can use HTTP Get API call to fetch water level and location information for a specific station. This API takes a StationID (full list is here) as a required input and some other optional parameters. As a response, it returns an XML document with the requested details. Let’s review the sample request and response below:
<data>
<metadata id="8594900" name="Washington" lat="38.8733" lon="-77.0217"/>
<observations>
<wl t="2023-07-09 19:30" v="8.232" s="0.023" f="1,0,0,0" q="p"/>
</observations>
</data>
The same method can be used to get real-time information about wind and currents as well. NOAA also publishes prediction/estimates about tidal levels etc. More details can be found here.
Now, let us add this logic to create a request payload, issue the HTTP call and retrieve the response from NOAA into a Python function. See code below:
import requests
import time
from datetime import datetime
# Fetch water level data from tidesandcurrents.noaa.gov
def fetch_water_level(station_id):
    url = "https://api.tidesandcurrents.noaa.gov/api/prod/datagetter"
    # Collect water level for one station
    payload = {
        "product": "water_level",
        "application": "Fabric EventStream",  # Replace with your application name
        "datum": "STND",
        "station": station_id,  # Set station ID
        "time_zone": "gmt",
        "units": "english",  # Use "english" for feet, "metric" for meters
        "format": "json",
        "date": "latest",
    }
    response = requests.get(url, params=payload)
    if response.status_code == 200:
        data = response.json()
        return data
    return None
You can test this Python function and explore some of the related information published by NOAA.
Ingesting Data into Fabric Eventstreams (using Python)
Now that we have a well-tested Python code to retrieve all the data we need from its source, let us see how we can package the same in a ‘EventData’ structure and send it on to a Fabric Eventstream. For now, we will focus on the Python code but in a subsequent, we will show how to connect the Python code to a Eventstream. Here is the code:
import time
import json
import asyncio
from datetime import datetime
from azure.eventhub import EventData
from azure.eventhub.aio import EventHubProducerClient

# The Eventstream connection string and name parameters
# These are made available to you when you create a Eventstream in the Fabric Portal
# We will show you how in the next section.
EVENTSTREAM_CONNECTION_STR = ""
EVENTSTREAM_NAME = ""

async def run():
    # Create a producer client to send messages to the EventStream.
    # Specify a connection string to your EventStream namespace and the eventstream name.
    producer = EventHubProducerClient.from_connection_string(
        conn_str=EVENTSTREAM_CONNECTION_STR, eventhub_name=EVENTSTREAM_NAME
    )
    # Specify the station ID
    stationID = "9445958"  # Sample Bremerton, WA [9445958]
    async with producer:
        while True:
            # Create a batch.
            event_data_batch = await producer.create_batch()
            # Fetch current water level in feet
            station_data = fetch_water_level(stationID)

            if station_data is not None:
                # Fetch station location
                data = station_data["data"]
                if len(data) > 0:
                    water_level = data[0]["v"]
                station_latitude = station_data["metadata"]["lat"]
                station_longitude = station_data["metadata"]["lon"]
                # Create a data point with the time and value
                current_time = datetime.now().strftime("%Y-%m-%d %H:%M:%S")
                # Generate the data structure
                water_point = {
                    "Current_time": current_time,
                    "Water Level Value": water_level,
                    "Station Latitude": station_latitude,
                    "Station Longitude": station_longitude,
                    "Station": "Water Station",
                }
                # Convert the curve data to JSON format
                json_water_data = json.dumps(water_point)
                event_data_batch.add(EventData(json_water_data))
                # Send the batch of events to the event hub.
                await producer.send_batch(event_data_batch)
            # Wait for 6 minutes before generating the next point
            time.sleep(360)

asyncio.run(run())
The above Python code acts as a Eventstream Producer/client and publishes water level data from NOAA every 6 minutes to it. This is the interval at which NOAA refreshes its data. Refreshing at a higher frequency would be redundant.
Before we move forward, let us highlight a couple of key points in the code:
- Eventstream Name & Connection string – These two variables identify the Eventstream that you want to publish the retrieved data. As we show in the next section, you can copy and paste this information once you create the Eventstream.
- azure-eventhub Python package – As documented in the Pre-requisite section, you must use “pip install” to install the required packages containing the APIs to set up the Azure EventHub producer client and publish/send events to it. In your Python code, make sure to import the necessary modules.
Create a Fabric Eventstreams and connect to the Data Source
Now, let us create the Fabric Eventstream that will receive the events that are produced by the Python code. Once it is created, we will connect the two using the name and connection string associated with the Eventstream.

We will use this connection string in the Python code. You can also use this connection string to ingest data from any other data sources that you might have like various sensors, servers or Kafka clusters.
Copy and paste the values from the UI above and in to the EVENTSTREAM_CONNECTION_STR and EVENTSTREAM_NAME variables in the Python code (as below). Note that the EventStream name is the last part of the connection string.
EVENTSTREAM_CONNECTION_STR = “Endpoint=sb://eventstream-bb78e885-1bf2-402a-9381-bfed4c65f3d9.servicebus.windows.net/;SharedAccessKeyName=key_[Removed];SharedAccessKey=[Removed];EntityPath=es_bb78e885-1bf2-402a-9381-bfed4c65f3d9″
EVENTSTREAM_NAME = “es_bb78e885-1bf2-402a-9381-bfed4c65f3d9”
Once the Python code has been connected to the Eventstream, you should start to see data flowing into it within several minutes. You can use the “Data preview” tab in the UI to view the incoming stream of data to check the data value and validate the data quality. You can also click on the “Data insights” tab to check whether the incoming data speed aligns with your expectation.


You will soon be able to do additional processing (if required) before writing the records to the KQL Database, such as aggregating data within a specific time window, filtering specific values, or managing columns etc. Stay tuned!
At this point, we have some Python code regularly retrieving data being published NOAA and pushing the same in to a Eventstream in our Fabric workspace. We need a place to persist all this data for longer-term analysis, reporting/dashboarding etc. Let us see how we can achieve this using KQL Databases and Power BI.
Real-time Analytics with KQL Databases
KQL database is a fast and highly scalable data exploration and analytics platform offered by Microsoft Fabric. It is designed for analyzing large volumes of diverse data in real-time, providing instant insights for a wide range of use cases. The next step is to connect Eventstream to KQL Database for further analysis.
For this step, an output wizard, that enables a no-code experience in a separate navigation pane, will guide you to complete the set up. Please make sure you select input format as Json.

After completing the setup, you can browse to the configured destination table and verify that the tides and currents data information is starting to flow into the KQL Database. You will start to see updated row count, data size, last ingestion and other related information.

When you click the table, you can select ‘query table’ option which will open the KQL query editing blade for you.

You can save this into a KQL Queryset.
Building Interactive Power BI Reports
Now that the data is flowing in to the KQL Databases through Eventstreams, you can now build a Power BI report. To do this, start by opening the KQL Queryset, in the top right-hand corner.

Now you can select the visualization. Here are three examples:
- Select “line chart” for water level. Then drag ‘Current_time’ as X-axis and ‘Water level value’ as Y-axis.
- Select “Map” and provide the ‘Station Latitude’ and “Station Longitude”, also the Station name
- Select “Card” and add the ‘latest Current_time’ to indicate the latest timestamp for incoming events.
Also you can click ‘format report page’ to set the auto refresh like this:

NOAA also provides real-time data for wind, currents and prediction of future water levels. You can use the same way to ingest data into Eventstream and visualize in Power BI report. The power BI report we showed in the beginning includes NOAA data from water level, wind, currents and future water level prediction.
Call To Action
As demonstrated above, with Microsoft Fabric Eventstreams, Python, and Power BI, you have the tools to seamlessly integrate data collection, storage, and visualization processes, empowering you to make data-driven decisions and monitor key trends in real-time. Follow this step-by-step guide, to start leveraging Fabric Eventstreams today and unlock the potential of real-time analytics for your use cases and scenarios.
Here are some useful links to docs and related resources that you might find useful: