Profiling Microsoft Fabric Spark Notebooks with Sparklens


Problem Statement:
You are a data engineer developing Spark notebooks using Microsoft Fabric. You are having performance issues and you want to know if your spark code is running efficiently. You also want to know if increasing the resources would improve its performance.
Discussion:
In this blog, you will learn how to leverage Sparklens, an open-source Spark profiling tool, to profile Microsoft Fabric Spark Notebooks and improve the performance of your spark code.
Note: Sparklens is not developed or owned by Microsoft. Please refer to the Sparklens github page to learn more.
When you are working with a spark application, you would typically use the profiler in the following scenarios:
- To reduce the Spark application execution time (save $$$ 😊)
- To evaluate if the application will be performant even with lesser resources (save more $$$ 😊)
Let’s consider a scenario where you have developed Spark notebook that processes 1000s of JSON files (~2B records), performs aggregation and writes back the results to a delta table in a Lakehouse. The job takes around 56 mins, and you want to improve it.
Here is the sample code snippet:
from pyspark.sql.functions import col, sum, avg

df_json = spark.read.option("inferSchema", "true").json("file_path")
aggregated_df = df_json.groupBy("country", "state").agg(
    avg("salary").alias("avg_salary"),
    sum("salary").alias("total_salary")
)
aggregated_df.write \
    .mode("append") \
    .format("delta") \
    .saveAsTable("employeeinsights")
Configuration
To configure and run Sparklens in your notebook, follow these steps:
- Download the Sparklens Jar and upload it to your Lakehouse, under the Files section as shown in Figure 1:

2. Go to the workspace settings and create a 3-node small pool. For profiling, its better to start with a small pool. Sparklens doesn’t work well with autoscaling, so disable it for the profiling exercise.

3. Copy the ABFS path of the sparklens jar file in your Lakehouse.

4. Add the ABFS path to spark.jars property in environment, configure the pool and publish the environment.

5. Attach the environment to the Fabric Notebook.
Scala Spark
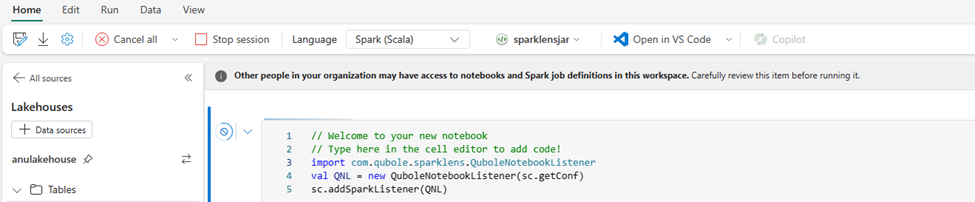
If you are using Scala as the programming language in your notebook, follow these steps:
Enable the Sparklens listener.
import com.qubole.sparklens.QuboleNotebookListener
val QNL = new QuboleNotebookListener(sc.getConf)
sc.addSparkListener(QNL)
Add your Spark code inside QNL.profileIt { } as shown below:
QNL.profileIt {
  val df_json = spark.read.option("inferSchema", "true").json("abfss://file_path")

  val aggregated_df = df_json.groupBy("country", "state") \
    .agg(avg("salary").alias("avg_salary"),
         sum("salary").alias("total_salary"))

   aggregated_df.write.mode("append").format("delta").saveAsTable("employeeinsights")
}
PySpark
If you are using Python as the programming language in your notebook, follow these steps:
- Enable Sparklens listener and run profiling:
from pyspark.sql.functions import col, sum, avg
import time

QNL = sc._jvm.com.qubole.sparklens.QuboleNotebookListener.registerAndGet(sc._jsc.sc())

if (QNL.estimateSize() != QNL.getMaxDataSize()):
    QNL.purgeJobsAndStages()
    startTime = int(round(time.time() * 1000))

    df_json = spark.read.option("inferSchema", "true").json("abfss://file_path")

    aggregated_df = df_json.groupBy("country", "state") \
    .agg(avg("salary").alias("avg_salary"),
         sum("salary").alias("total_salary"))

   aggregated_df.write.mode("append").format("delta").saveAsTable("employeeinsights")

    endTime = int(round(time.time() * 1000))
    time.sleep(QNL.getWaiTimeInSeconds())
    print(QNL.getStats(startTime, endTime))
Interpreting Profiling Report
Now, let’s interpret the Sparklens profiling output.
Sparklens reports the following metrics:
- Driver and Executor wall clock time
- Critical path
- Simulates wallclock time by adding or reducing executors
- Compute wastage and utilization
- Task Skews
Ran this profiling on custom pool (3 Small compute nodes with 4 vCore and 32 GB). One of the important metrics when running Spark jobs is execution time. This job ran for 56 min and 57 sec as shown in Figure 6.
Apache Spark pool instance consists of one head node and two or more worker nodes with a minimum of three nodes in a Spark instance. The head node runs extra management services such as Livy, Yarn Resource Manager, Zookeeper, and the Spark driver. All nodes run services such as Node Agent and Yarn Node Manager. All worker nodes run the Spark Executor service.

Driver and Executor wall clock time
Here is the sample Sparklens report (Figure 7). Driver wallclock time is the amount of time spent by a driver is 0.26% and the executor wallclock time is 99.74%. The time spent by driver should be significantly less than executors as tasks run on executors.

Critical path
We usually think if we have infinite resources, applications will run faster. This might not be true in all cases. Critical path is the minimal amount of time with infinite resources. For our case here in Figure 8, adding more executors will improve the performance significantly.
The report shows even with perfect parallelism and zero skew, there won’t be a significant performance difference.

Sparklens simulates executor wall clock time and cluster utilization by adding more resources as shown in Figure 8. This helps to analyze how adding more resources impacts performance and cluster utilization.
Three other important metrics in this Figure 9 are:
PRatio is parallelism on stage. Number of tasks in stage divided by total number of executor cores. PRatio is 312 in Stage 29, which means it requires 312 iterations to run all the 2500 tasks.
TaskSkew represents the degree of skew in the stage. Lower is better.

Tuning based on profiling
Based on the profiling run, tuning to consider are increasing the executors in Environment to increase the degree of parallelism.
Running Sparklens on Medium pool and after increasing the executors to 5 (8 Cores and 56 GB Memory) from 1. Execution time is reduced to 8 min and 46 sec from around 56 mins.

Sparklens report below shows there is still room to improve, if we add more executors the execution time will be reduced to 2min and 3sec as show in Figure 11.

Advantages
- Compatibility: Sparklens is compatible with Spark 3.x after configuring the build.sbt file and provides valuable insights into resource optimization.
- License: It’s an open-source tool and free to use, so no vendor lock-in.
- Ease of use: Sparklens’ reports are user-friendly and easy to interpret. You don’t have to be an expert to tune your spark jobs anymore.
Limitations
- Auto Scaling Impact: With auto scaling enabled, model error increases. Disabling it results in lower error and higher accuracy.
- Contributor Status: Unfortunately, there have been no active contributors for the past 3 years. So it would be great if you can roll up your sleeves to make it better!!!
References and further reading:
qubole/sparklens: Qubole Sparklens tool for performance tuning Apache Spark (github.com)
Apache Spark pool concepts – Azure Synapse Analytics | Microsoft Learn
Develop, execute, and manage notebooks — Microsoft Fabric | Microsoft Learn